
Mapa mental
organizing data in tables
Conteúdo do mapa
organizing data in tables
Graphs are a good means of describing, exploring or summarising numerical data because the use of a visual image can simplify complex information and help to highlight patterns and trends in the data
- types
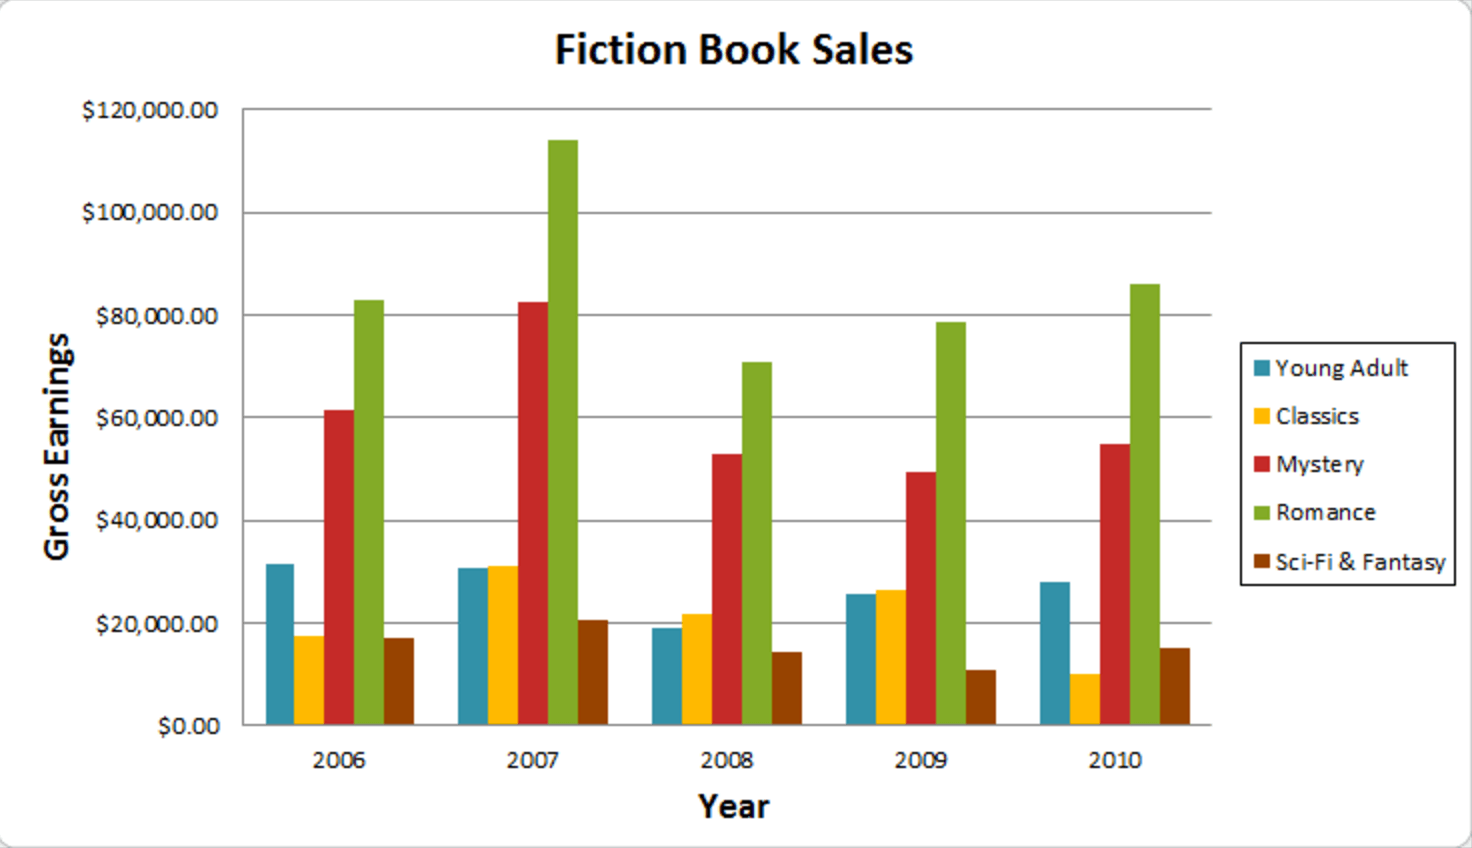
- Bar charts
- The graph is constructed such that the heights or lengths of the different bars are proportional to the size of the category they represent.
- we can use it when we need to compare results of different questions
- The graph is constructed such that the heights or lengths of the different bars are proportional to the size of the category they represent.
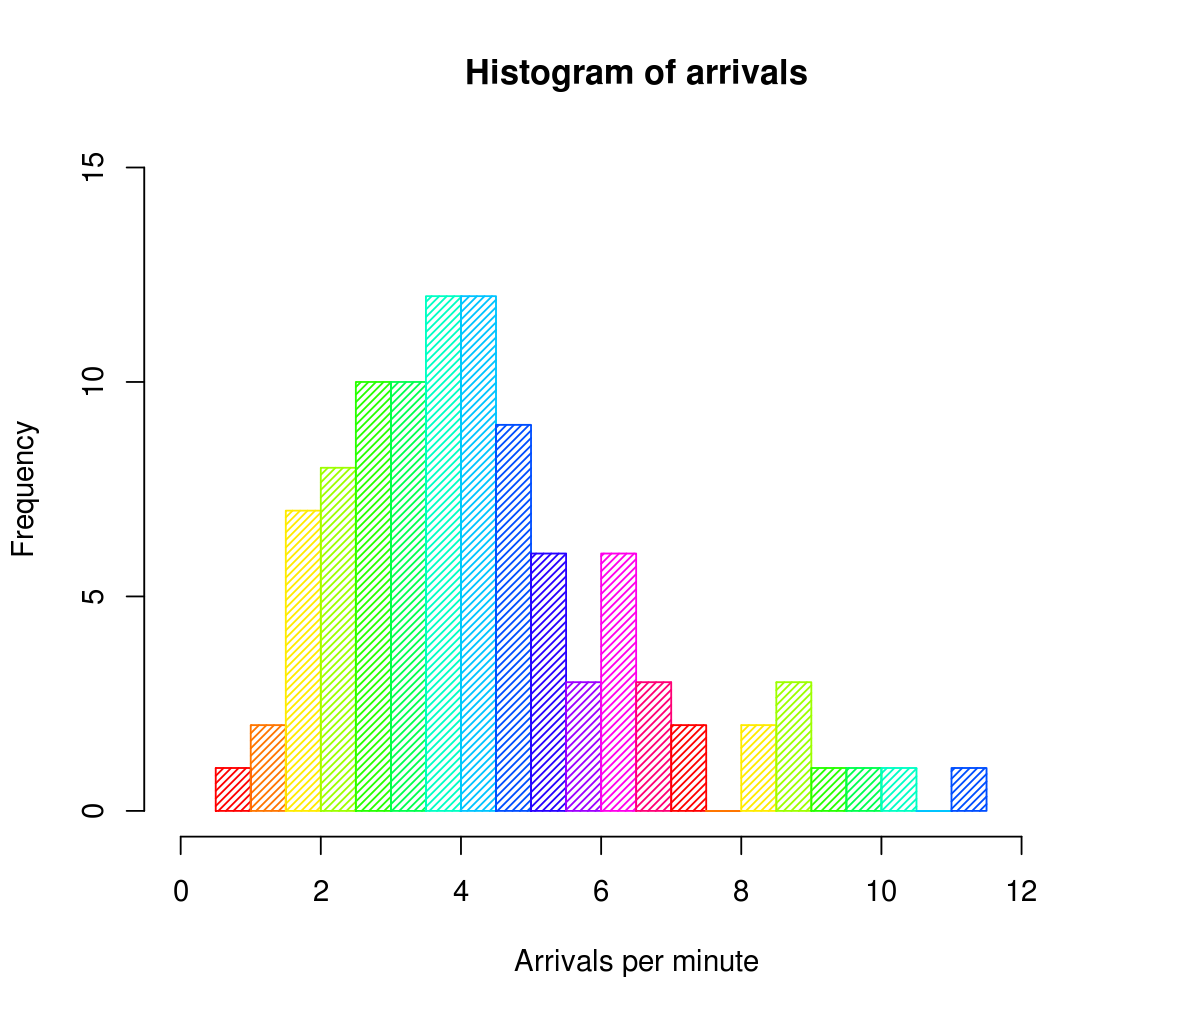
- Histograms
- histogram could be used to present details of the average number of hours exercise carried out by people of different ages because age is a continuous rather than a discrete category,histogram both the x- and y-axes have a scale
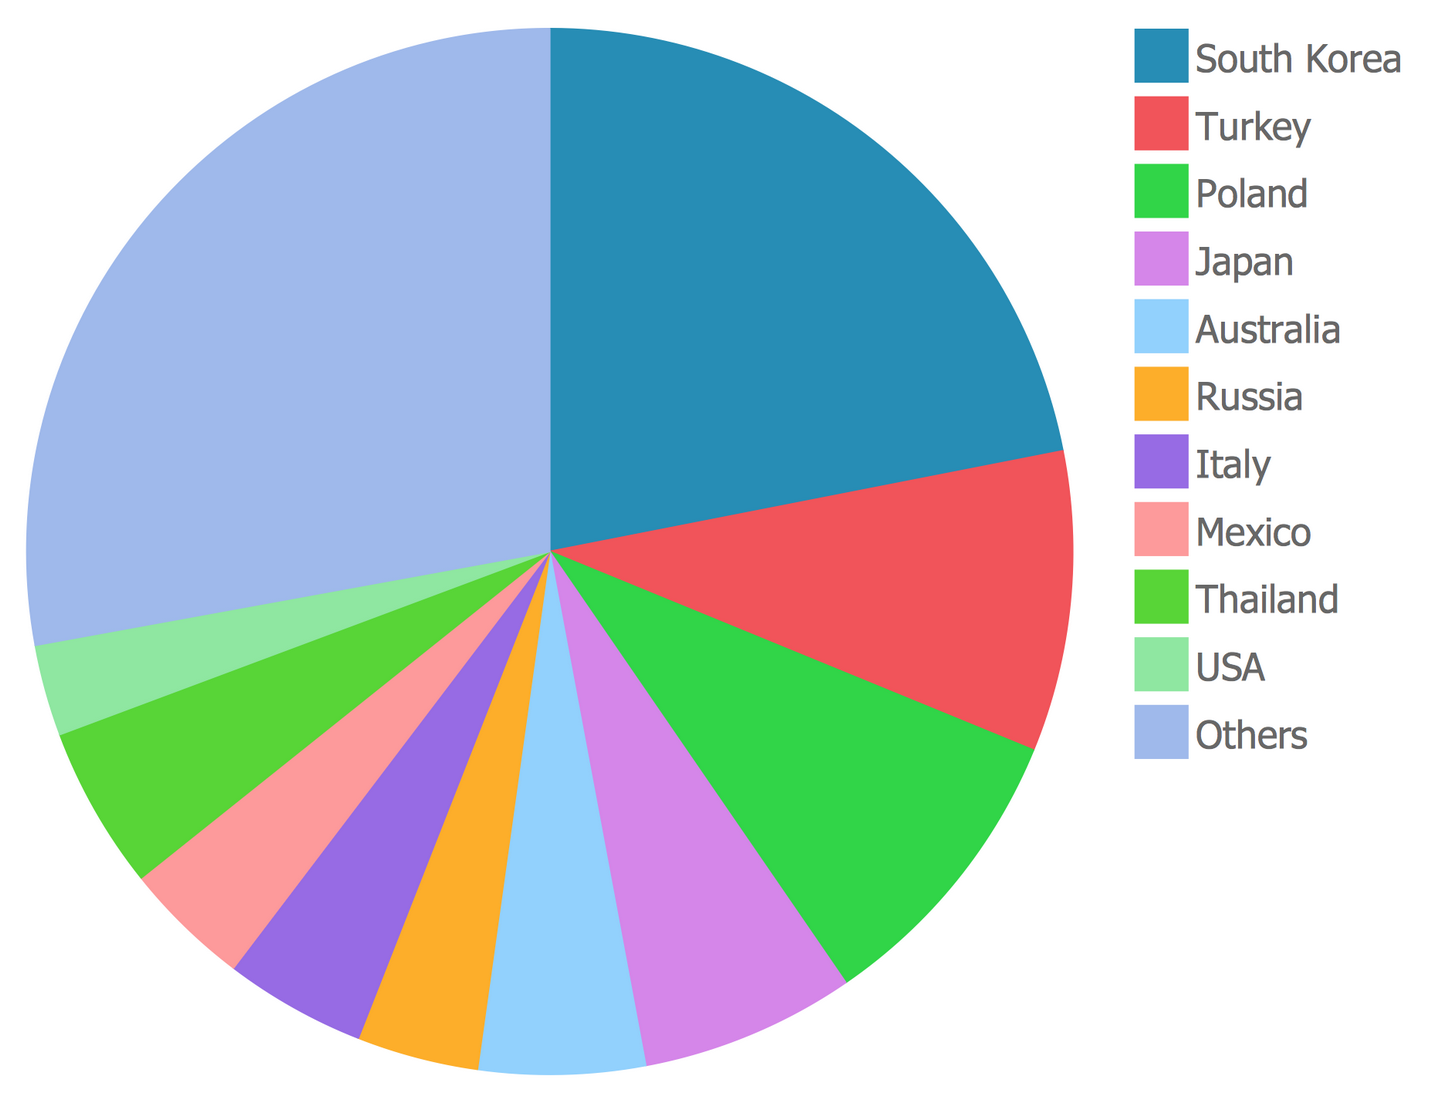
- Pie charts
- Pie charts are a visual way of displaying how the total data are distributed between different categories, They are generally best for showing information grouped into a small number of categories and are a graphical way of displaying data that might otherwise be presented as a simple table
- scatter points
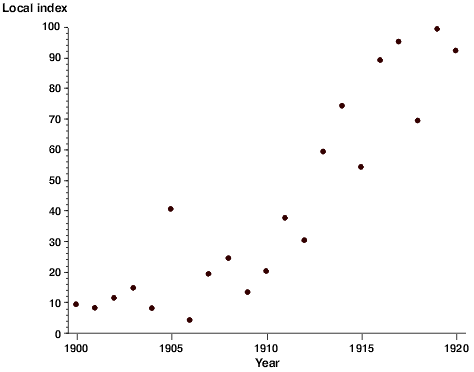
- Scatter plots are used to show the relationship between pairs of quantitative measurements made for the same object or individual, Regression lines can also be added to the graph and used to decide whether the relationship between the two sets of measurements can be explained or if it is due to chance
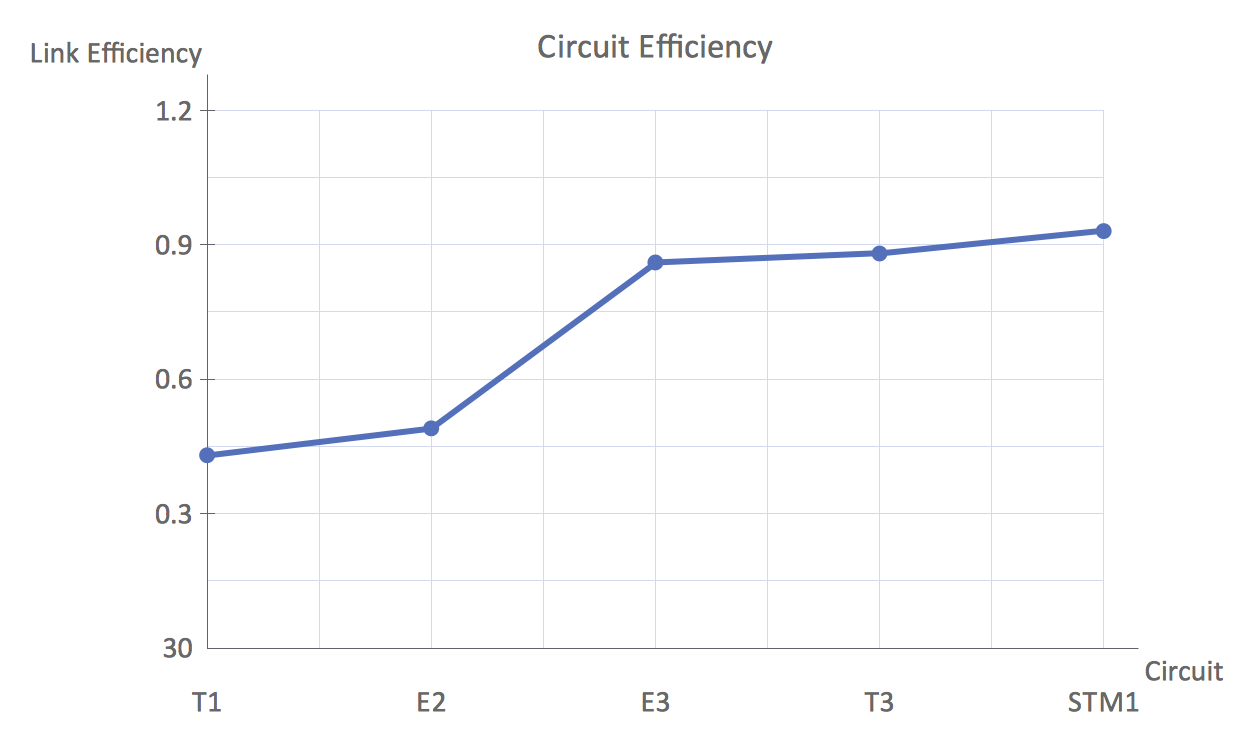
- line graphs
- Line graphs are usually used to show time series data – that is how one or more variables vary over a continuous period of time, In a line graph the x-axis represents the continuous variable (for example year or distance from the initial measurement) whilst the y-axis has a scale and indicates the measurement..
- Bar charts
- types
parts
- The chart area defines the boundary of all the elements related to the graph including the plot itself and any headings and explanatory text. It emphasises that these elements need to be considered together and that they are separate from the surrounding text.
- The plot area is the region containing the data. It is bounded by the x- and y-axes to the bottom and left side
- The x-axis is the horizontal line that defines the base of the plot area. Depending upon which type of graph is being considered different locations on the x -axis represent either different categories (such as years) or different positions along a numerical scale (such as temperature or income).
- The y-axis is the vertical line that usually defines the left side of the plot area, but if more than one variable is being plotted on the graph then the vertical lines on both the left and right sides of the plot area may be used as y-axes. The y-axis always has a numerical scale and is used to show values such as counts, frequencies or percentages
- Gridlines are the vertical and horizontal lines placed within the plot area to help read values from the graph. The gridlines should be subtle and not detract from the data. In the case of simple graphs it is not always necessary to include them.
- All graphs should include a title that summarises what the graph shows. The title should identify what is being described (e.g. speeding offences detected by automatic cameras) and the units of measurements (e.g. percentages, total number, frequency)
- If the graph you are presenting is based on data from another publication then you should acknowledge the source of the original data somewhere within the chart area or title.
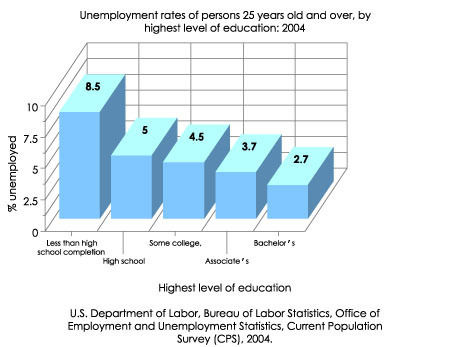
- Many PC-based graphing packages offer the possibility of producing graphs and charts with a 3D effect.
how can use this in the school
- Second, functions and graphs represent one of the earliest points in mathematics at which a student uses one symbolic system to expand and understand another (e.g., algebraic functions and their graphs, data patterns and their graphs, etc.).
- Broadly speaking, the function of teachers is to help students learn by imparting knowledge to them and by setting up a situation in which students can and will learn effectively. But teachers fill a complex set of roles, which vary from one society to another and from one educational level to another.
- to seach a function in a graph theThe x value of a point where a vertical line intersects a function represents the input for that output y value. If we can draw any horizontal line that intersects a graph more than once, then the graph does not represent a function because that y value has more than one input.
- Properties of Functions: Definition of a Function: A function is a rule or formula that associates each element in the set X (an input) to exactly one and only one element in the set Y (the output). Different elements in X can have the same output, and not every element in Y has to be an outpu
Imagens e arquivos do mapa
Informações
- Descrição
- Noveno Tecnología Mapa Mental sobre organizing data in tables, criado por Julian Rodriguez em 27-05-2019.
- Criado por
- Julian Rodriguez
- Visualizações
- 0
- Histórico
-
- Criado por Julian Rodriguez · 22 mai 2019
- Copiado por Julian Rodriguez · 27 mai 2019
- Avaliação