
Quiz
Final practice
Este quiz tem tipos de pergunta que abrem no player de sempre.
Perguntas do quiz (44)
1Non-experimental research does not involve any manipulation and the equivalent of the IV is called the [blank_start]predictor[blank_end], while the equivalent of the DV is called the [blank_start]criterion[blank_end].
- Apredictor
- Bcriterion
2Types of measurement:
[blank_start]ORDINAL[blank_end] - relative rankings between the values
[blank_start]NOMINAL/CATEGORICAL[blank_end] - type of values differ, one or the other (2 levels of the same category)
[blank_start]RATIO[blank_end] - measured on a numeric continuum with a true 0 point
[blank_start]INTERVAL[blank_end] - measured on an equally spaced numeric continuum with no absolute 0 point- AORDINAL
- BNOMINAL/CATEGORICAL
- CRATIO
- DINTERVAL
3Inferential statistics include calculations of SD and variance.
- AVerdadeiro
- BFalso
4The percentage value for all the individuals that data is available for is called:
- APercent
- BCumulative percent
- CValid percent
- DFrequency
- ETrue percent
5Problematic data can be fixed by:
- using the [blank_start]mean[blank_end] or [blank_start]median[blank_end]
- removing [blank_start]outliers[blank_end]- Amean
- Bmedian
- Coutliers
6Real limits describe the specific highest and lowest values of the range of a grouping (e.g. 8 and 10 for a grouping of 8-10)
- AVerdadeiro
- BFalso
7The bars in bar charts are touching, while the bars in histograms do not touch.
- AVerdadeiro
- BFalso
8Bar charts measure [blank_start]categorical[blank_end] frequencies, while histograms measure [blank_start]interval[blank_end] or [blank_start]ratio[blank_end] variable frequencies.
- Acategorical
- Binterval
- Cratio
9The best type of figure to use to determine whether a certain category is over or under-represented would be:
- Abar chart
- Bhistogram
- Cfrequency polygon
- Dfrequency table
- Epie chart
10A skewness statistic would be considered significant if it was greater than __ or less than __.
- A2, -2
- B1, -1
- C3, -3
- D4, -4
11A leptokurtic peak would be indicated by a negative kurtosis statistic.
- AVerdadeiro
- BFalso
12A leptokurtic peak would be indicated by a negative kurtosis statistic.
- AVerdadeiro
- BFalso
13A skewed distribution would most likely to be reported using what measure of central tendency?
- AMode
- BMean
- CMedian
14In a positively skewed distribution, the mean would be [blank_start]higher[blank_end] than the median. In a negatively skewed distribution, the mean would be [blank_start]lower[blank_end].
- Ahigher
- Blower
- Cthe same
- Dlower
- Ehigher
- Fthe same
15Systematic error from calculating variance based on sample parameters is corrected by doing what?
- ASquaring the numbers
- BTaking the absolute value
- CDividing by N-1
- DNone of the above
16Normal distributions are created based on collected data that is perfectly normal.
- AVerdadeiro
- BFalso
17Normal distributions can be compared with each other freely as they use all the same types of measurement.
- AVerdadeiro
- BFalso
18Normal distributions use what symbols?
- Aμ
- Bσ
- CX̄
- Ds
19The mean of a standard normal distribution always equals...
- A1
- B0
- Cdepends on the data
- D-1
201 z-score is equal to 1 [blank_start]standard deviation[blank_end] unit.
- Astandard deviation
21When the population mean and standard deviation are known, the standardized distribution does NOT assume that the variable is normally distributed.
- AVerdadeiro
- BFalso
22[blank_start]Sampling error[blank_end] is systematic error that involves sample statistics differing from population statistics.
- ASampling error
23Binomial distributions are used for:
- AVariables with only 2 categories
- BBimodal distributions
- CMultimodal distributions
- DNormal distributions
- ENominal level of measurement
- FInterval level of measurement
24The z-test is used when the population SD is unknown.
- AVerdadeiro
- BFalso
25There is a higher chance of rejecting H0 when...
- Athe sample size is larger
- Bthe sample size is smaller
- Cthe value of alpha is larger
- Dthe value of alpha is smaller
- Ethe alternative hypothesis is non-directional
- Fthe alternative hypothesis is directional
26A [blank_start]smaller[blank_end] standard error of the mean would show a better representation of the population.
- Asmaller
- Blarger
27The [blank_start]central limit theorem[blank_end] states that when an infinite number of random samples are drawn, they approximate a normal distribution so that the mean equals the population mean, and SD equals the standard error of the mean.
- Acentral limit theorem
28Larger variability in population scores results in larger variability in sample means.
- AVerdadeiro
- BFalso
29Less variability can be achieved by smaller sample sizes.
- AVerdadeiro
- BFalso
30t-distributions don't change shape because the mean is always = 0.
- AVerdadeiro
- BFalso
31A larger alpha value would result in [blank_start]smaller[blank_end] critical values.
- Asmaller
- Blarger
32A confidence interval is a range of values that may include the [blank_start]population mean[blank_end]. e.g. A 95% CI implies that 95% of the [blank_start]sample means[blank_end] fall within it.
- Apopulation mean
- Bsample means
33A more precise CI would be calculated if the sample size was smaller.
- AVerdadeiro
- BFalso
34A higher desired level of confidence would result in a [blank_start]wider[blank_end] CI.
- Awider
- Bnarrower
352 sample means that are far apart may not be statistically significant likely due to a small [blank_start]effect size[blank_end].
- Aeffect size
36Cohen's d is the magnitud eof differences between 2 means measured in [blank_start]standard deviation[blank_end] units.
- Astandard deviation
37Cohen's d effect size:
small = [blank_start]0.20[blank_end]
medium = [blank_start]0.50[blank_end]
large = [blank_start]0.80[blank_end]- A0.20
- B0.10
- C0.30
- D0.50
- E0.40
- F0.60
- G0.80
- H0.90
- I1.00
- J1.20
- K0.70
38A statistically significant result from a Shapiro-Wilk's Test would indicate...
- Athe variance between the 2 samples are not different
- Bthe variance between the 2 samples is different
- Cthe distribution is perfectly normal
- Dthe distribution is not perfectly normal
39Label the following table regarding types of error.
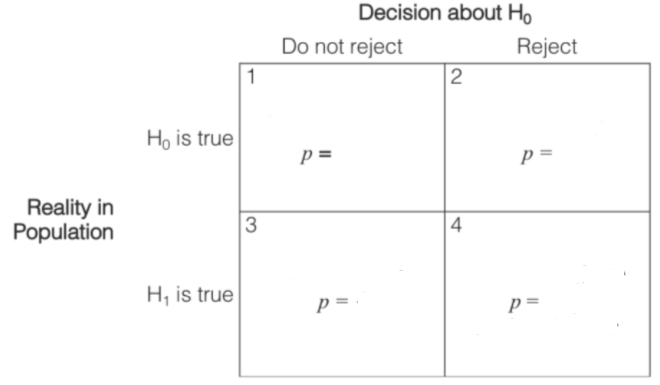
- ACorrect decision
- BCorrect decision.
- C1 - α
- DType I error
- Eα
- FType II error
- Gβ
- H1 - β
40Reducing alpha can result in [blank_start]Type II[blank_end] error.
- AType II
- BType I
- Cno
41Type II errors are most likely related to fluctuations, undetectable effects, and research design issues.
- AVerdadeiro
- BFalso
42Type I error can be controlled via:
- Areducing alpha
- Bincreasing sample size
- Cincreasing alpha
- Dusing a directional alternative hypothesis
- Eincreasing in-group variability
- Fdecreasing within-group variability
43Type II error can be controlled for via:
- Areducing alpha
- Bincreasing alpha
- Cusing a directional alternative hypothesis
- Dincreasing sample size
- Edecreasing within-group variability
- Fincreasing in-group variability
44H0:
z-test / t-test: [blank_start]μ = 25 seconds[blank_end]
independent sample t-test: [blank_start]μ done something = μ not done something[blank_end]
paired means: [blank_start]μ = 0[blank_end]
ANOVA: [blank_start]all μs are equal[blank_end]
Pearson product moment: [blank_start]ρ = 0[blank_end]- Aμ = 25 seconds
- Bμ done something = μ not done something
- Cμ = 0
- Dall μs are equal
- Eρ = 0
Informações
- Descrição
- Kinesiology (KIN 371) Quiz sobre Final practice, criado por Christy W em 22-04-2018.
- Autor
- Christy W
- Idioma
- English
- Visualizações
- 5
- Etiquetas
- Avaliação
- Ainda sem avaliações Avalie este quiz