Venn Diagram questions
Slides in this set (4)
-
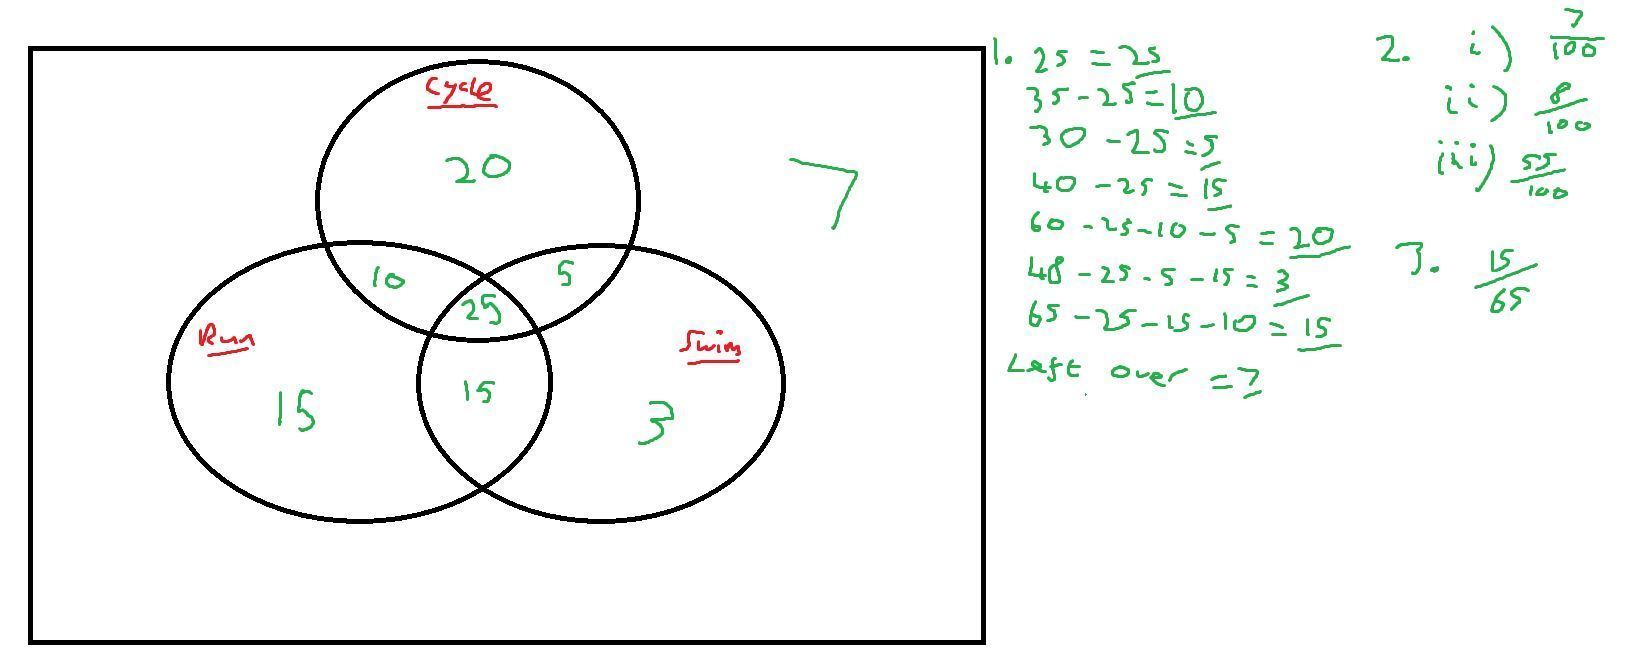
- Survey of 100 people shown : 65 run , 48 swim , 60 cycle , 40 run and swim , 30 swim and cycle , 35 run and cycle , 25 do all three
- 1. Draw a Venn diagram to represent this data
- Find the probability of selecting someone who:
- i. Takes none of these as an exercise
- ii. Swims but does not run
- iii. Takes at least two of these types of exercise
- 3. Jason is one of the above group. Given that he runs, find the probability that he swims but does not cycle
-
-
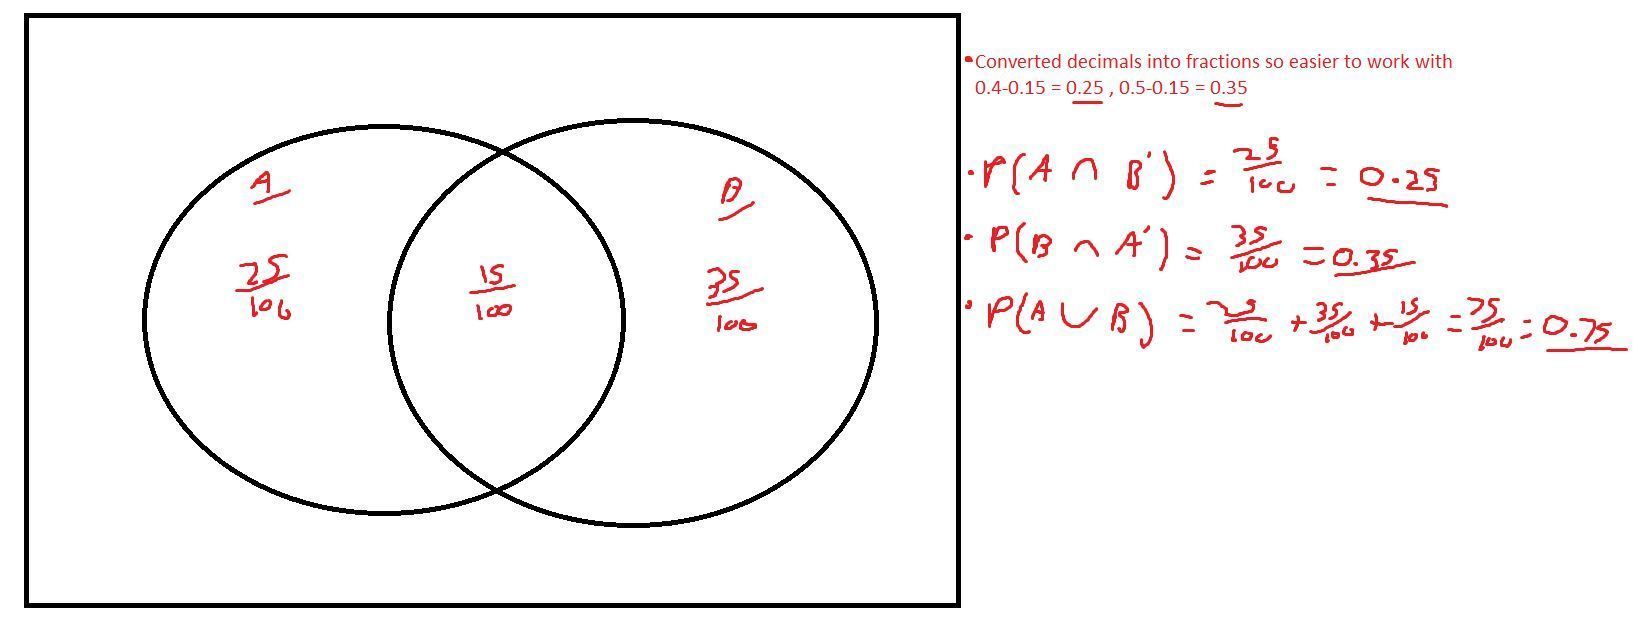
- A Venn diagram consists of the two option A and B. P(A) = 0.4 , P(B) = 0.5 and P(A∩B) = 0.15
- 1. Find P(A∩B')
- 2. Find P(B∩A')
- 3. Find P(A∪B)
-