
Karteikarten
Scatter Plot Shapes
Karten in diesem Stapel (11)
- 1HeteroscedasticFans out around the linear. Increasing variance with Y axis for example
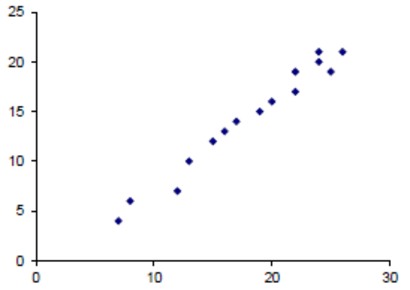
- 2—Strong, linear, positive relationship (y increases as x increases). Linear because we could imagine a straight line passing through the points
- 3—Weak, linear, positive relationship
(y tends to increases with x )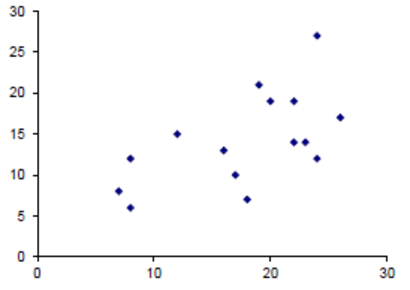
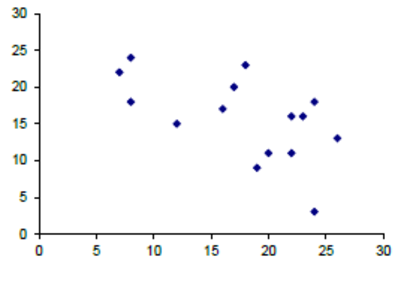
- 4—Weak, linear, negative relationship (y tends to decrease with x )
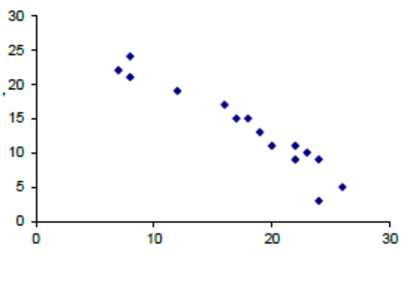
- 5—Strong, linear, negative relationship (y decreases with x )
- 6—Little or No relationship
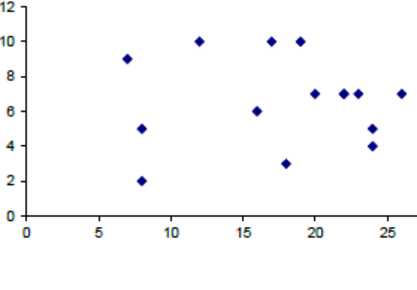
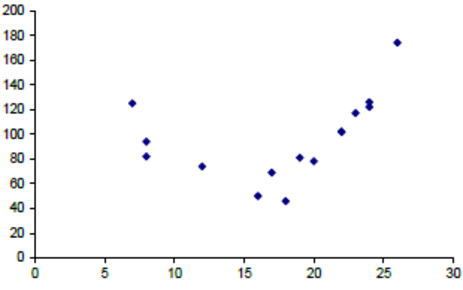
- 7—Strong relationship, but non-linear, possibly quadratic.
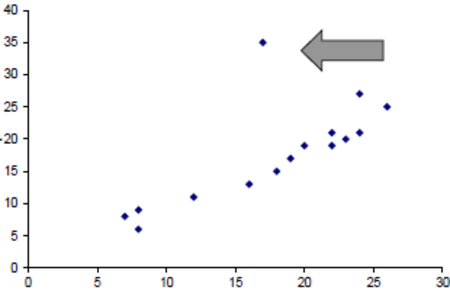
- 8—Strong linear positive relationship, but with an obvious unusual point known as an outlier. Little variance (Heteroscedastic)
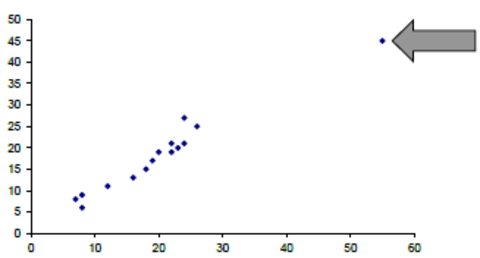
- 9—Strong linear positive with Outliner on line of best fit (Influential point)
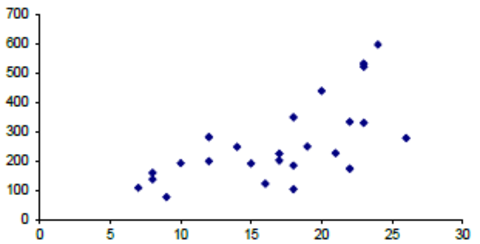
- 10—Some sort of linear relationship as Y tends to increase with X, but the variation in Y increases with x, giving a fan out effect
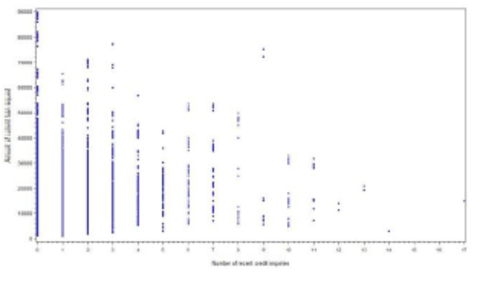
- 11—Variance of Y decreases with X (Heteroscadastic). X is rounded or discrete. A few outliers are present. Possibly has a downward trend
Informationen
- Beschreibung
- Bsc Hons Data Mining Karteikarten am Scatter Plot Shapes, erstellt von Steve Hiscock am 15/12/2013.
- Erstellt von
- Steve Hiscock
- Aufrufe
- 20
- Tags
- Bewertung