
Karteikarten
AS Psychology: Research Methods - Quantitative and Qualitative Data
Karten in diesem Stapel (12)
- 1MEASURES OF CENTRAL TENDENCY Mean (Statistical Average)PROS: Takes all scores into account
CONS: Can be distorted by extreme scores - 2MEASURES OF CENTRAL TENDENCY Median (Middle Value)PROS: Unaffected by extreme scores = gives a representative value
CONS: Less sensitive = doesn't take all values into account - 3MEASURES OF CENTRAL TENDENCY Mode (Most Frequent)PROS: Useful in categorical data (e.g - no of babies securely attached)
CONS: Not useful to describe data when there are several modes - 4MEASURE OF DISPERSION Range (Smallest score taken away from the Largest)PROS: Easy to calculate
CONS: Range can be distorted by extreme scores - 5MEASURE OF DISPERSION Standard Deviation (Measure of dispersion that indicates the spread of data around a central value)PROS: Takes account of all scores; Sensitive measure of dispersion
CONS: More difficult to calculate compared to range - 6MEASURE OF DISPERSION Standard Deviation TypesLarge S.D - A lot of variation around the mean
Small S.D - Data 'closely clustered' around the mean
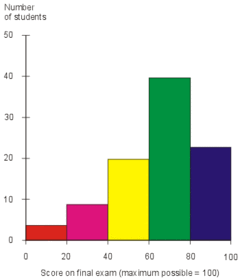
Zero S.D - All data values were the same - 7HistogramContinuous Scale: Bars are joined together and are of identical width
Commonly used to show scores (e.g - tests) - 8Bar ChartHas one data series = simple
Can represent frequencies of single statistics (e.g - mean of a sample)
Discontinuous (aren't joined together)
Likely to be used when comparing groups of data.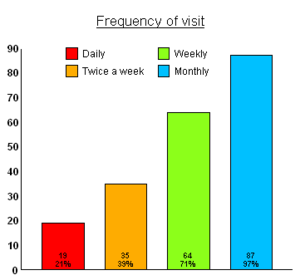
- 9ScattergramUsed to show strength and relationship of correlations
Can be either positive, negative, or without correlation
The correlation is determined with a line of best fit.
(+0.99 = STRONG POSITIVE
-0.64 = STRONG NEGATIVE)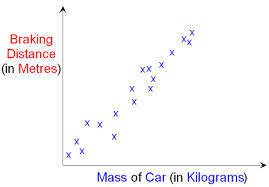
- 10Content Analysis (Converts qualitative data into quantitative)1) Sampling
2) Creation of Coding System
3) Pilot Study Conducted
4) Conduct the Analysis
5) Make into quantitative display
6) Check reliability (compare results) - 11Content Analysis (Pros & Cons)PROS: Very simple and relatively quick method of the analysis of qualitative data
CONS: Can be interpreted differently by different researchers - 12Pure Qualitative AnalysisData is transcribed
Data is read through repeatedly to detect recurrent themes
All data read and re-read until all emerging themes have been identified (that account for all data collected)
Informationen
- Beschreibung
- Karteikarten am AS Psychology: Research Methods - Quantitative and Qualitative Data, erstellt von Asterisked am 09/02/2015.
- Erstellt von
- Asterisked
- Aufrufe
- 91
- Tags
- Bewertung