
Mindmap
Voting Behaviour in the UK
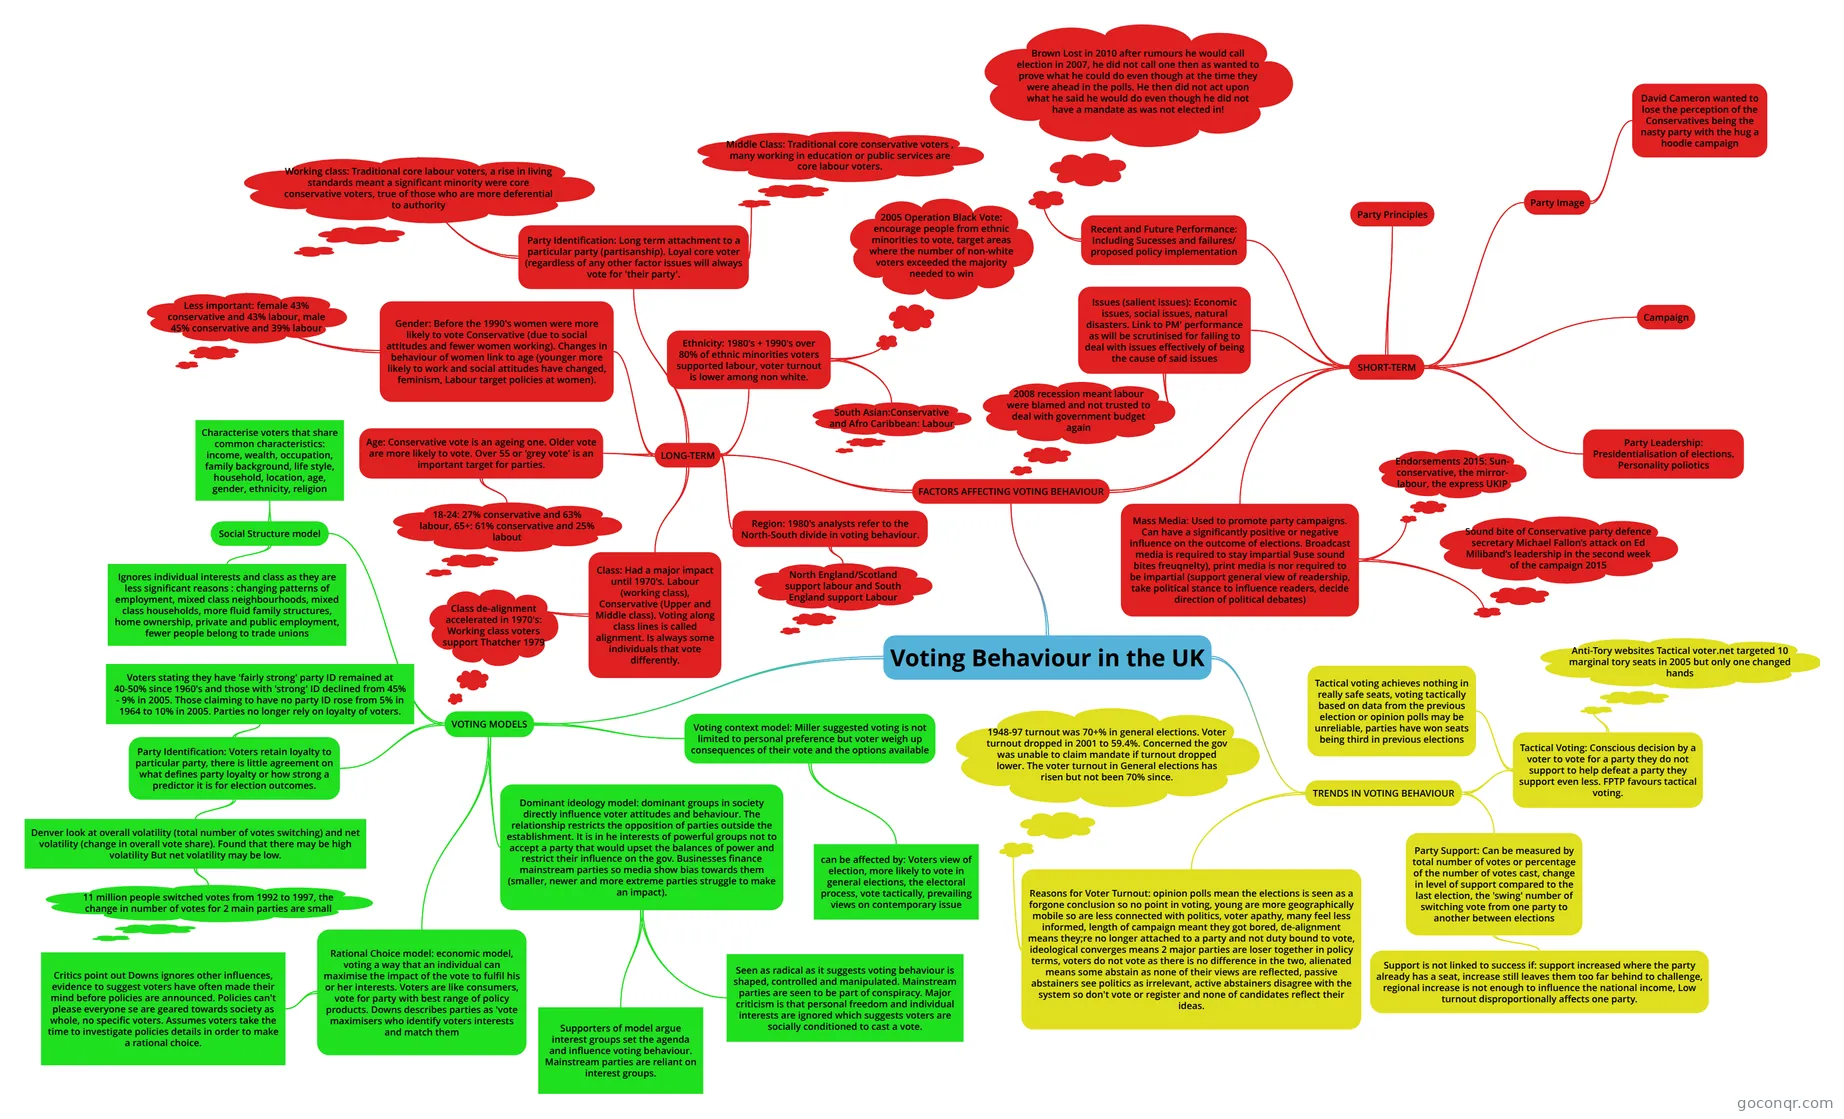
Mind map: Voting behaviour in the UK
Inhalt der Mindmap
Voting Behaviour in the UK
FACTORS AFFECTING VOTING BEHAVIOUR
- SHORT-TERM
- Issues (salient issues): Economic issues, social issues, natural disasters. Link to PM' performance as will be scrutinised for failing to deal with issues effectively of being the cause of said issues
- 2008 recession meant labour were blamed and not trusted to deal with government budget again
- Recent and Future Performance: Including Sucesses and failures/ proposed policy implementation
- Brown Lost in 2010 after rumours he would call election in 2007, he did not call one then as wanted to prove what he could do even though at the time they were ahead in the polls. He then did not act upon what he said he would do even though he did not have a mandate as was not elected in!
- Party Principles
- Party Leadership: Presidentialisation of elections. Personality poliotics
- Party Image
- David Cameron wanted to lose the perception of the Conservatives being the nasty party with the hug a hoodie campaign
- Mass Media: Used to promote party campaigns. Can have a significantly positive or negative influence on the outcome of elections. Broadcast media is required to stay impartial 9use sound bites freuqnelty), print media is nor required to be impartial (support general view of readership, take political stance to influence readers, decide direction of political debates)
- Sound bite of Conservative party defence secretary Michael Fallon’s attack on Ed Miliband’s leadership in the second week of the campaign 2015
- Endorsements 2015: Sun- conservative, the mirror- labour, the express UKIP
- Campaign
- Issues (salient issues): Economic issues, social issues, natural disasters. Link to PM' performance as will be scrutinised for failing to deal with issues effectively of being the cause of said issues
- LONG-TERM
- Class: Had a major impact until 1970's. Labour (working class), Conservative (Upper and Middle class). Voting along class lines is called alignment. Is always some individuals that vote differently.
- Class de-alignment accelerated in 1970's: Working class voters support Thatcher 1979
- Age: Conservative vote is an ageing one. Older vote are more likely to vote. Over 55 or 'grey vote' is an important target for parties.
- 18-24: 27% conservative and 63% labour, 65+: 61% conservative and 25% labout
- Gender: Before the 1990's women were more likely to vote Conservative (due to social attitudes and fewer women working). Changes in behaviour of women link to age (younger more likely to work and social attitudes have changed, feminism, Labour target policies at women).
- Less important: female 43% conservative and 43% labour, male 45% conservative and 39% labour
- Ethnicity: 1980's + 1990's over 80% of ethnic minorities voters supported labour, voter turnout is lower among non white.
- South Asian:Conservative and Afro Caribbean: Labour
- 2005 Operation Black Vote: encourage people from ethnic minorities to vote, target areas where the number of non-white voters exceeded the majority needed to win
- Region: 1980's analysts refer to the North-South divide in voting behaviour.
- North England/Scotland support labour and South England support Labour
- Party Identification: Long term attachment to a particular party (partisanship). Loyal core voter (regardless of any other factor issues will always vote for 'their party'.
- Middle Class: Traditional core conservative voters , many working in education or public services are core labour voters.
- Working class: Traditional core labour voters, a rise in living standards meant a significant minority were core conservative voters, true of those who are more deferential to authority
- Class: Had a major impact until 1970's. Labour (working class), Conservative (Upper and Middle class). Voting along class lines is called alignment. Is always some individuals that vote differently.
- SHORT-TERM
VOTING MODELS
- Social Structure model
- Characterise voters that share common characteristics: income, wealth, occupation, family background, life style, household, location, age, gender, ethnicity, religion
- Ignores individual interests and class as they are less significant reasons : changing patterns of employment, mixed class neighbourhoods, mixed class households, more fluid family structures, home ownership, private and public employment, fewer people belong to trade unions
- Party Identification: Voters retain loyalty to particular party, there is little agreement on what defines party loyalty or how strong a predictor it is for election outcomes.
- Voters stating they have 'fairly strong' party ID remained at 40-50% since 1960's and those with 'strong' ID declined from 45% - 9% in 2005. Those claiming to have no party ID rose from 5% in 1964 to 10% in 2005. Parties no longer rely on loyalty of voters.
- Denver look at overall volatility (total number of votes switching) and net volatility (change in overall vote share). Found that there may be high volatility But net volatility may be low.
- 11 million people switched votes from 1992 to 1997, the change in number of votes for 2 main parties are small
- Rational Choice model: economic model, voting a way that an individual can maximise the impact of the vote to fulfil his or her interests. Voters are like consumers, vote for party with best range of policy products. Downs describes parties as 'vote maximisers who identify voters interests and match them
- Critics point out Downs ignores other influences, evidence to suggest voters have often made their mind before policies are announced. Policies can't please everyone se are geared towards society as whole, no specific voters. Assumes voters take the time to investigate policies details in order to make a rational choice.
- Dominant ideology model: dominant groups in society directly influence voter attitudes and behaviour. The relationship restricts the opposition of parties outside the establishment. It is in he interests of powerful groups not to accept a party that would upset the balances of power and restrict their influence on the gov. Businesses finance mainstream parties so media show bias towards them (smaller, newer and more extreme parties struggle to make an impact).
- Supporters of model argue interest groups set the agenda and influence voting behaviour. Mainstream parties are reliant on interest groups.
- Seen as radical as it suggests voting behaviour is shaped, controlled and manipulated. Mainstream parties are seen to be part of conspiracy. Major criticism is that personal freedom and individual interests are ignored which suggests voters are socially conditioned to cast a vote.
- Voting context model: Miller suggested voting is not limited to personal preference but voter weigh up consequences of their vote and the options available
- can be affected by: Voters view of election, more likely to vote in general elections, the electoral process, vote tactically, prevailing views on contemporary issue
- Social Structure model
TRENDS IN VOTING BEHAVIOUR
- Reasons for Voter Turnout: opinion polls mean the elections is seen as a forgone conclusion so no point in voting, young are more geographically mobile so are less connected with politics, voter apathy, many feel less informed, length of campaign meant they got bored, de-alignment means they;re no longer attached to a party and not duty bound to vote, ideological converges means 2 major parties are loser together in policy terms, voters do not vote as there is no difference in the two, alienated means some abstain as none of their views are reflected, passive abstainers see politics as irrelevant, active abstainers disagree with the system so don't vote or register and none of candidates reflect their ideas.
- 1948-97 turnout was 70+% in general elections. Voter turnout dropped in 2001 to 59.4%. Concerned the gov was unable to claim mandate if turnout dropped lower. The voter turnout in General elections has risen but not been 70% since.
- Party Support: Can be measured by total number of votes or percentage of the number of votes cast, change in level of support compared to the last election, the 'swing' number of switching vote from one party to another between elections
- Support is not linked to success if: support increased where the party already has a seat, increase still leaves them too far behind to challenge, regional increase is not enough to influence the national income, Low turnout disproportionally affects one party.
- Tactical Voting: Conscious decision by a voter to vote for a party they do not support to help defeat a party they support even less. FPTP favours tactical voting.
- Tactical voting achieves nothing in really safe seats, voting tactically based on data from the previous election or opinion polls may be unreliable, parties have won seats being third in previous elections
- Anti-Tory websites Tactical voter.net targeted 10 marginal tory seats in 2005 but only one changed hands
- Reasons for Voter Turnout: opinion polls mean the elections is seen as a forgone conclusion so no point in voting, young are more geographically mobile so are less connected with politics, voter apathy, many feel less informed, length of campaign meant they got bored, de-alignment means they;re no longer attached to a party and not duty bound to vote, ideological converges means 2 major parties are loser together in policy terms, voters do not vote as there is no difference in the two, alienated means some abstain as none of their views are reflected, passive abstainers see politics as irrelevant, active abstainers disagree with the system so don't vote or register and none of candidates reflect their ideas.
Informationen
- Beschreibung
- A-Level Government and Politics (UK Politics) Mindmap am Voting Behaviour in the UK, erstellt von Sophie Conisbee am 12/01/2018.
- Erstellt von
- Sophie Conisbee
- Aufrufe
- 8
- Bewertung