
Quiz
Standard Deviation and Percentiles
Create a free account to finish this quiz
Save your progress and see your final score.
Already have an account? Sign in
Questions in this quiz (18)
1What is the equation for Population Standard Deviation?
- AThis equation has a big N on the bottom, and it does not have a square root.
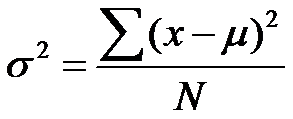
- BThis equation has a big N on the bottom, and it has a square root.
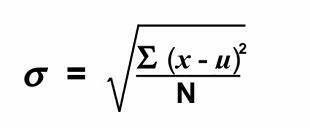
- CThis equation has n-1 on the bottom, and it has a square root.
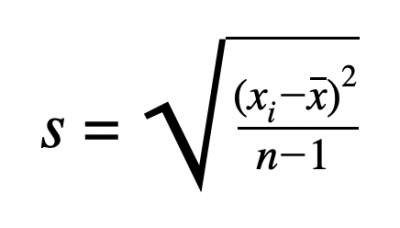
- DThis equation has n-1 on the bottom, and it does not have a square root.
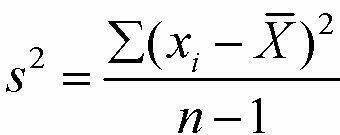
- AThis equation has a big N on the bottom, and it does not have a square root.
2What is the equation for Sample Variance?
- AThis equation has n-1 on the bottom, and it has no square root.
- BThis equation has n-1 on the bottom, and it has a square root.
- CThis equation has N on the bottom, and it has a square root.
- DThis equation has N on the bottom, and it has no square root.
- AThis equation has n-1 on the bottom, and it has no square root.
3What is the equation for Sample Standard Deviation?
- AThis equation has n-1 on the bottom and has no square root.
- BThis equation has n-1 on the bottom and has a square root.
- CThis equation has N on the bottom and has a square root.
- DThis equation has N on the bottom and has no square root.
- AThis equation has n-1 on the bottom and has no square root.
4What is the equation for Population Variance?
- AThis equation has n-1 on the bottom and has no square root.
- BThis equation has n-1 on the bottom and has a square root.
- CThis equation has N on the bottom and has a square root.
- DThis equation has N on the bottom and has no square root.
- AThis equation has n-1 on the bottom and has no square root.
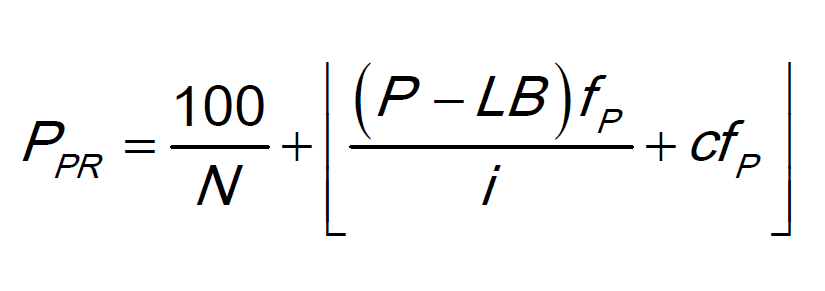
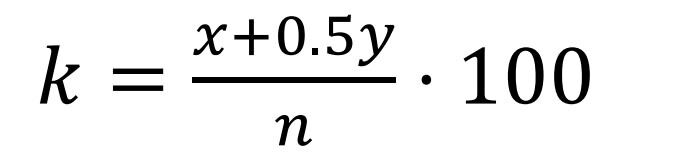
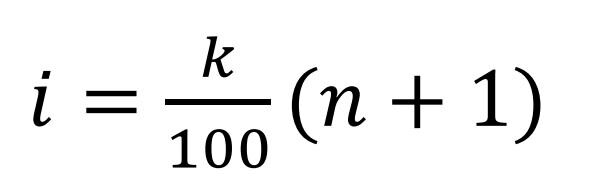
5Your data set is: 1, 2, 3, 4. Find the 9th percentile. For this question, which equation would you use?
- AThis equation is equal to a P. And there is a 100 in there.
- BThis equation is equal to a k.
- CThis equation is equal to an i. And there is a 100 in there.
- DThis equation is equal to an s, and it sums things up.
- AThis equation is equal to a P. And there is a 100 in there.
6Your data set is: 1, 2, 3, 4. In which percentile is number 4? For this question, which equation would you use?
- AThis equation equals an i. And it has a 100 in it.
- BThis equation has a P and a 100 in it. P for percentile.
- CThis equation has a P in it. P for percentile.
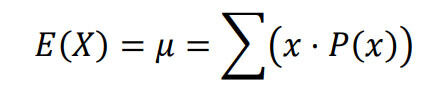
- DThis equation is equal to k.
- AThis equation equals an i. And it has a 100 in it.
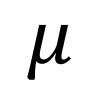
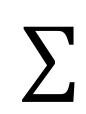
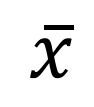
7Which of the following symbols stands for the mean?
- AThis is a "u" like symbol called "Mu"
- BThis is a capital sigma, which looks like a strange E.
- CThis is called "x bar" because it is an x with a bar over it.
- DThis is lowercase sigma, which looks like a fancy "o"

- AThis is a "u" like symbol called "Mu"
8What does this symbol mean?
- ATo add things up.
- BTo times the number by itself.
- CTo square root the number.
- DThis is a symbol for the mean.
9What is the correct order of operations?
- AParentheses, exponents, multiplication, division, addition, subtraction
- BMultiplication, division, parentheses, exponents, addition, subtraction
- CMultiplication, division, addition, subtraction, parentheses, exponents
- DParentheses, exponents, addition, subtraction, multiplication, division
10Which one is a decimal percentile?
- A15th percentile
- B32nd percentile
- C20th percentile
- D64th percentile
11Which percentile gives you the 3rd Quartile?
- A25th percentile
- B50th percentile
- C75th percentile
- D100th percentile
12You square root at the end of a sample variance problem.
- ATrue
- BFalse
13Which equation helps you find the mean?
- AThis equation adds numbers because it has a capital sigma. But it also multiplies numbers together.
- BThis equation adds numbers because it has a capital sigma. It also divides numbers.
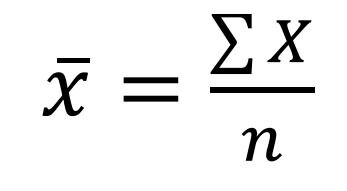
- CThis equation has a capital sigma to add numbers; it has division; and it has exponents.
- DThis equation has no sigma, so no numbers are added.
- AThis equation adds numbers because it has a capital sigma. But it also multiplies numbers together.
14How do you find range?
- AR= Maximum number - Minimum number
- BR= Minimum number - Maximum number
- CR= Q1 - Q3
- DR= Q3 - Q1
15How do you find Interquartile range?
- AIQR= Maximum number - Minimum number
- BIQR= Minimum number - Maximum number
- CIQR= Q1 - Q3
- DIQR= Q3 - Q1
16Math Question! What is the mean of: 2, 7, 15, 34 ?
- A15
- B14.5
- C11.6
- D4
17Math Time! Find the range of: 2, 3, 9, 10, 44
- A13.6
- B42
- C9
- D34
18Students got test scores of 50, 69, 75, 83, 88, 98, 100. Which equation would you use to find the 50th Percentile?
- AThis equation is equal to k.
- BThis equation is equal to i. And it has a 100 in it.
- CThis equation is equal to s (squared) , and it adds things up.
- DThis equation has a 100 in it, and a P. P is for percentile.
- AThis equation is equal to k.
Information
- Description
- This quiz helps distinguish certain symbols and equations involved in the first couple chapters of Statistics.
- Author
- Serenity Brooks
- Language
- English
- Views
- 75
- Tags
- Rating
- No ratings yet Rate this quiz