
Flashcards
Untitled
Cards in this deck (218)
- 1Ecological Maxims1. Organisms interact and are interconnected
2. Everything goes somewhere
3. No population can increase in size forever
4. Finite energy and resources result in tradeoffs
5. Organisms evolve
6. Communities and ecosystems change over time
7. Spatial scale matters - 2PopulationA group of individuals of a species living and interacting in a particular area.
- 3CommunityAssociation of populations of different species in the same area.
- 4EcosystemCommunity of organisms and the physical environment
- 5LandscapeAreas with substantial differences, typically involving multiple ecosystems.
- 6BiosphereAll living organisms on Earth and their environments.
- 7AdaptationA characteristic that improves survival or reproduction.
- 8Natural SelectionIndividuals with certain adaptations tend to survive and reproduce at a higher rate than other individuals, and so those adaptations become more prevalent in a community.
- 9Net Primary Productivity (NPP)GPP - respiration.
The energy left over for plant growth and for consumption by predators. - 10Ecological Experiments1. Assignments of treatments or control
2. Replication
3. Random assignment of treatments
4. Statistical analysis - 11UpliftWhen warm air rises above denser, cooler air. Pressure drops with altitude, so as air rises it expands and cools.
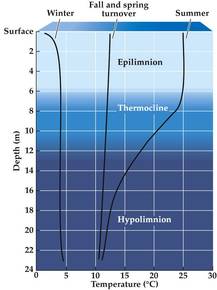
- 12Lake Stratification
- 13Hadley CellWhen warm air from tropic uplift reaches the stratosphere and moves towards the poles, and sinks back down at 30 N and 30 S. Results in dry, arid zones.
- 14SubsidenceDown flowing air from cells
- 15Ferrell CellCauses temperate zones
- 16Polar CellsCauses polar zones
- 17Prevailing WindsAir movements caused by circulation cells
- 18Coriolis EffectAppearance of winds to be deflected due to Earth's rotation.
Easterlies: flow from E
Westerlies: flow from W - 19Semipermanent H/L Pressure CellsHigh pressure over oceans in summer and high pressure over continents in winter. Causes prevailing winds to switch in the summer/winter.
- 20UpwellingDeep ocean water that rises to surface, where prevailing winds blow PARALLEL to the coastline. Brings nutrients from sediment.
- 21Photic ZoneWhere light penetrates.
- 22Maritime ClimateCoastal areas, with little variation in seasonal temperatures. High humidity.
- 23Continental ClimateGreater variation in seasonal temperatures.
- 24Rain ShadowWindward slope has high precipitation, and the leeward slope very little.
- 25AlbedoAmount of reflectivity of an object.
High albedo = reflects lots of sun
Low albedo = absorbs lots of sun - 26EpilimnionWarm water that lies over the hypolimnion in summer
- 27HypolimnionCold water that lies below the epilimnion in summer.
- 28ThermoclineZone of transition in water temperature
- 29TurnoverOccurs in spring and fall when water temperature and density becomes uniform with depth. Causes mixing of nutrients from sediment.
- 30Milakovitch CyclesGlacial-interglacial cycles explained by regular changes in the shape of earth's orbit and its tilt.
- 31BiomesLarge-scale biological communities shaped by climate. Categorized by dominant plant forms.
- 32Plant Growth FormsDeciduous Trees: moist, seasonally warm/cool fertile soils
Cacti/Shrubs: dry, seasonally hot/cool
Needle-leaved Trees: moist, seasonally warm/cool infertile soils
Grasses/Sedges: moist, seasonally warm/cool, with fire
Evergreen Broadleaf Trees: wet, warm year-round
Forbs: seasonally cool
Sclerophyllus Shrubs: seasonally dry/moist and wet/cool - 33ConvergenceEvolution of similar growth forms among distantly related species, in response to similar selection pressures.
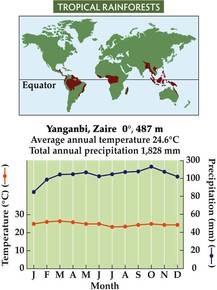
- 34Tropical Rainforests
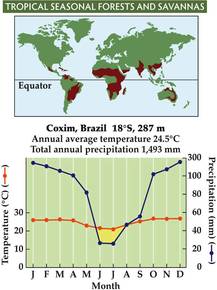
- 35Tropical Seasonal Forests and Savannas
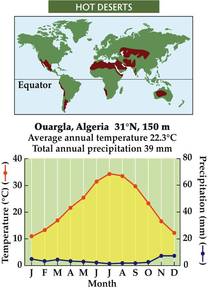
- 36Hot Deserts
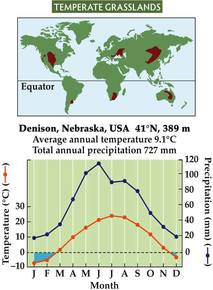
- 37Temperate Grasslands
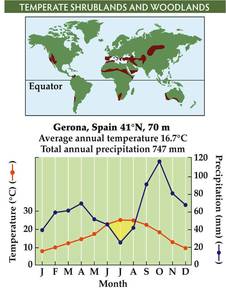
- 38Temperate Shrublands and Woodlands
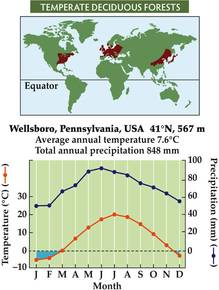
- 39Temperate Deciduous Forests
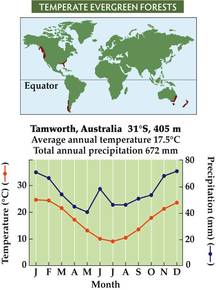
- 40Temperate Evergreen Forests
- 41Boreal Forests
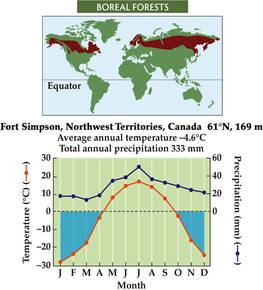
- 42Tundra
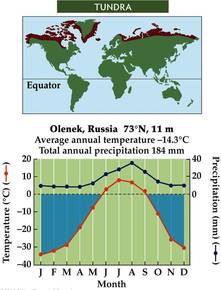
- 43Tropical RainforestsHigh biomass, high diversity. Emergents: plants rising above canopy.
Understory: trees growing in canopy shade. - 44Tropical Seasonal Forests and SavannahsWet and dry seasons associated with movement of ICTZ. Shorter, deciduous trees in dry seasons, more grasses and shrubs. Sparser forests promoted by fires.
- 45Hot DesertsHigh temps, low moisture. Sparse vegetation and animal populations. Low water constrains plant abundance.
- 46Temperate GrasslandsWarm, moist summers and cold, dry winters. Grasses dominate - more roots to cope with dry conditions. Accumulation of organic matter and high soil fertility.
- 47Temperate Shrublands and WoodlandsFalls are more wet so growing season is actually in fall even though it's cooler. Evergreen trees can be active during cooler, wetter periods, and have lower nutrient requirements.
- 48Temperate Deciduous ForestsResponse to extended periods of freezing. Fertile soil and good climate.
- 49Temperate Evergreen ForestsIncludes temperate rainforests but spans a wide range of environmental conditions. Nutrient-poor soil.
- 50Boreal ForestsLong, severe winters. Permafrost prevents drainage and results in saturated soils.
- 51TundraSmall growing season and cold temperatures. More sedges and grass.
- 52LoticFlowing water
- 53Benthic OrganismsBottom-dwellers
- 54Hyperhoic ZoneSubstratum below and adjacent to stream.
- 55LenticStill water
- 56Littoral ZoneNear shore
- 57Pelagic ZoneOpen water
- 58Climate EnvelopeRange of conditions over which a climate occurs.
- 59StressEnvironmental change results in decreased rates of physiological processes, lowering potential for growth or reproduction.
- 60EcotypePopulations with adaptations to unique environments
- 61PubescenceHairs on leafs that reflect solar energy. Help reduce conductive heat loss.
- 62Boundary LayerZone of turbulent flow due to friction next to leaf surface. Thick BL = low heat loss, thin BL = high heat loss.
- 63HoloparasitePlants with no photosynthetic pigments that gain energy from other plants.
- 64HemiparasitePhotosynthetic plants that also obtain nutrients, water, and some energy from a host plant.
- 65Environmental Control of Physiological Processes
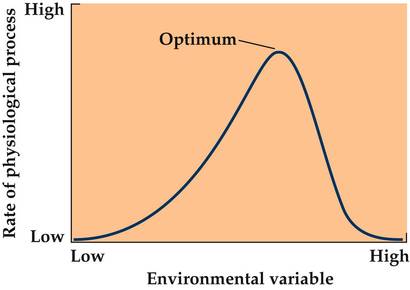
- 66Light Response CurveShows influence of light levels on photosynthesis. Light compensation point: where CO2 uptake is balanced by CO2 loss.
Saturation point: where photosynthesis no longer increases as light increases. - 67Light Compensation Curve
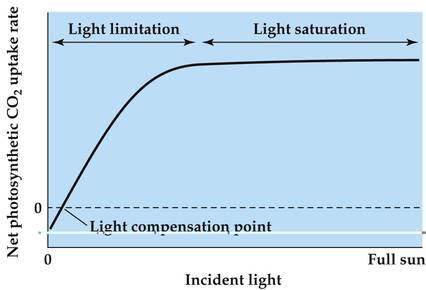
- 68Optimal Foraging TheoryAnimals maximize amount of energy gained per unit time, energy, and risk involved in finding food.
P = E/t, where P = profitability of food item, E = energy animal obtains from food, and t= time spent finding and obtaining food - 69Marginal Value TheorumAn animal should stay in a patch until the rate of energy gain has declined to match the average rate for the whole habitat. Influenced by distances between patches. The further away patches are, the longer an animal should spend in a patch.
- 70Optimal Foraging Theory
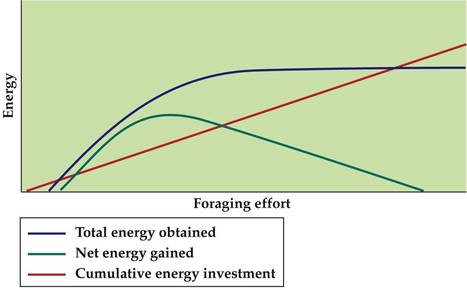
- 71Marginal Value Theorum
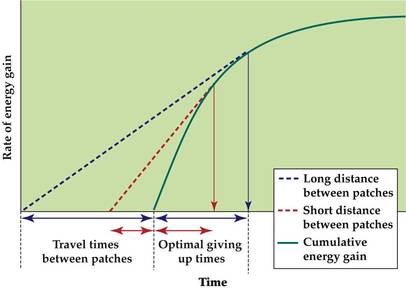
- 72EvolutionGenetic change over time or a process of descent with modification
- 73Directional Selection
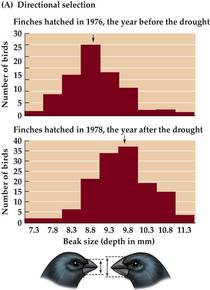
- 74Stabilizing Selection
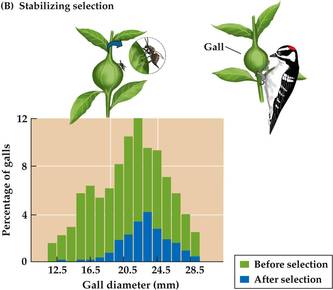
- 75Disruptive Selection
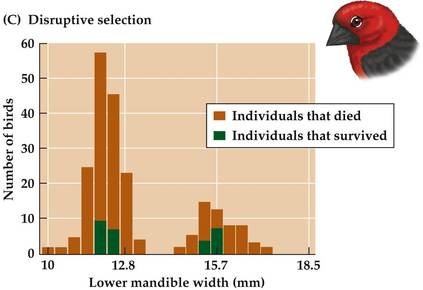
- 76Genetic DriftOccurs when chance events determine which alleles are passed to the next generation. Significant only for small populations.
1. Acts by chance alone, causing allele frequencies to fluctuate at random.
2. Because some alleles are lost, genetic variation of population is reduced.
3. Frequency of handful of alleles can increase if alleles only have mildly deleterious effects
4. Differences between population can increase - 77Gene FlowAlleles move between populations via movement of individuals or gametes.
1. Populations become more similar
2. New alleles can be introduced into a population - 78Adaptive EvolutionTraits that confer advantages tend to increase in frequency over time. Consistently caused by natural selection.
- 79ClinesPatterns of change in a characteristic over a geographic region.
- 80Constraints on Evolution1. Lack of genetic variation - if there is no beneficial allele, adaptive evolution at that gene cannot occur
2. Evolutionary History: natural selection works on traits that already exist. Organisms have certain traits and lack others because of their ancestry.
3. Ecological Tradeoffs: the ability to perform one function may reduce the ability to perform another. - 81SpeciationThe process by which one species splits into two or more species. Most commonly occurs when a barrier prevents gene flow bewteen populations.
Increases by genetic drift, decreases by gene flow. - 82Life HistoryRecord of events relating to an organism's growth, development, reproduction, and survival.
- 83Life History StrategyOverall pattern in average timing and nature of life history events.
- 84FitnessGenetic contribution to future generations.
- 85Phenotypic PlasticityOne genotype may produce different phenotypes when under different environmental conditions.
- 86MorphsContinuous range of sizes, or discrete types caused by plasticity.
- 87AllometryDifferent body parts grow at different rates.
- 88Direct DevelopmentFertilized egg develops into juvenile without passing through a larval stage
- 89Complex Life CyclesHave at least 2 stages, with different body forms and that live in different habitats
- 90SemelparousSpecies that reproduce only once
- 91HeroparousSpecies can reproduce multiple times.
- 92r-selectionIntrinsic rate of increase of a population. Live fast, die young.
- 93K-selectionPopulation carrying capacity. Slower growth rates. Slow and steady.
- 94DisturbanceAny process that destroys biomass
- 95Grimes Triangle
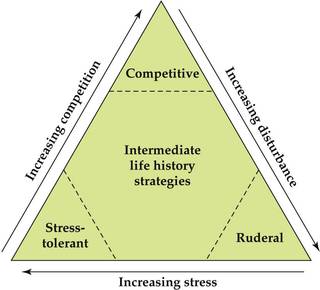
- 96Competitive PlantsLow stress, low disturbance.
- 97Stress-tolerant PlantsHigh stress, low disturbance. Not palatable to herbivores. Slow rates of water and nutrient use.
- 98Ruderal PlantsLow stress, high disturbance. Short life span, rapid growth rates.
- 99SenescenceDecline in physiological function with age.
- 100GenetSingle genetic individual
- 101RametMembers of a genet with individual physiology.
- 102Cooperative BreedingOffspring postpone breeding to help parents raise more offspring. Advantageous when high-quality territories are scarce.
- 103Population Size (mark recapture)N=M x C/R
- 104Survival RateSx. Chance that an individual or age x will survive to age x + 1.
- 105SurvivorshipIx. Proportion of individuals that survive from birth to age x.
- 106FecundityFx. Average number of offspring a female will have at age x.
- 107Survivorship Curve Type 1
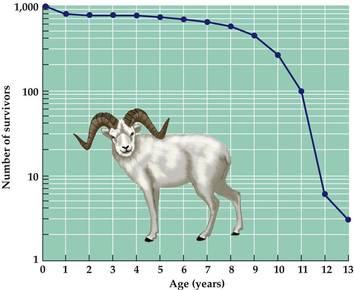
- 108Survivorship Curve Type II
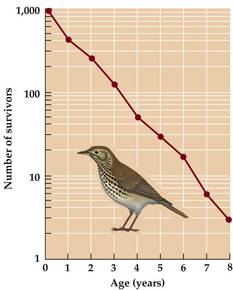
- 109Survivorship Curve Type III
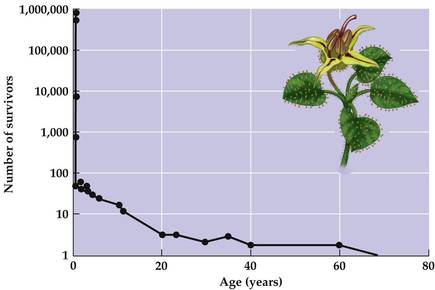
- 110Age Structure
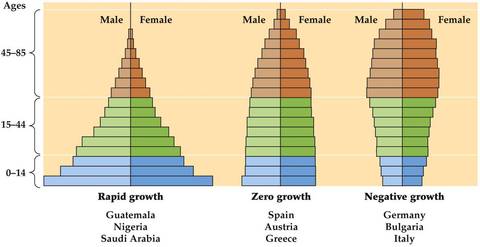
- 111Life Table DataTo predict population size for the next year, calculate 1. the number of individuals that will survive to the next time period (Sx x nx)
2. The number of offspring those survivors will produce in the next time period - 112Growth RateLambda. Ratio of population size in year t + 1 to population size in year t.
lambda = nt + 1/nt - 113Geometric GrowthPopulation reproduces in synchrony at discrete time periods, and the growth rate doesn't change. Population increases by a constant proportion.
Nt+1 = lambda x Nt - 114Exponential GrowthWhen individuals reproduce continually and generations overlap.
dN/dt = rN
r = exponential growth rate - 115Logistic GrowthPopulation increases rapidly, then stabilizes at carrying capacity. Growth rate decreases as population reaches K.
dN/dt = rN(1-N/K) - 116Population RegulationDensity-dependant factors cause population to increase when density is low and decrease when density is high.
- 117Demographic StochasticityConstant B and D rates but actual individual fates may vary.
- 118Environmental StochasticityUnpredictable changes in environment that can cause extinctions of small populations.
Change in B and D rates. - 119Allee EffectsAt low densities, individuals have difficulty finding mates so growth rate decreases as population density decreases. Can reduce a small population even further.
- 120Exploitative CompetitionSpecies compete indirectly. Individuals reduce availability of a resource as they use it.
- 121Interference CompetitionSpecies compete directly for resources.
- 122Competitive ExclusionCompeting species are more likely to coexist when they use resources in different ways.
- 123Competitive Exclusion Principle2 species that use a limiting resource in the same way cannot coexist.
- 124Resource PartitioningSpecies using a limited resource in different ways.
- 125Lotha-Volterra Competition ModeldN1/dt = r1N1(1-N1+aN2/K1)
dN2/dt=r2N2(1-N2+bN1/K2)
a and b are competition coefficients
Coexistence occurs when
a - 126Carrying Capacity
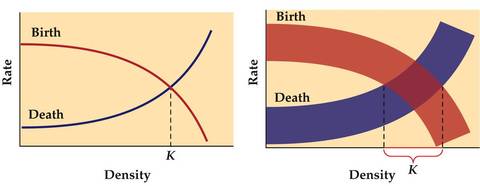
- 127MetapopulationA set of spatially isolated populations linked by dispersal of individuals or gametes
- 128ExploitationRelationship where one organisms benefits by feeding on and directly harming another
- 129ParasitoidsInsects that lay eggs in or on a host, and the resulting larvae usually eat and kill the host.
- 130Aposematic ColourationBright colours that warn predators of toxicity
- 131CrypsisCamoflauge resembling background
- 132MastingReproductive effort is synchronized in plants across a region. They hide in 'time' and overwhelm predators by numbers.
- 133CompensationRemoval of plant tissue stimulates new growth. Full compensation = no net loss of plant material.
- 134Secondary compoundsToxic chemicals produced by plants to reduce herbivory.
- 135Lag Effect
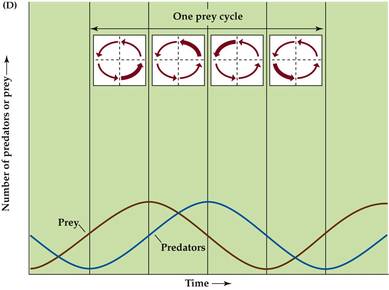
- 136SymbiontsOrganisms that live in or on other organisms. Not always parasitic.
- 137Positive InteractionsOccur when neither species is unharmed and the benefits of interactions are greater than the costs for at least one species. Same as facilitation.
- 138MutualismMutually beneficial interaction between individuals of 2 species
- 139CommensalismIndividuals of 1 species benefit while individuals of another species do not benefit and are not harmed.
- 140Trophic MutualismMutualist receives energy or nutrients from partner.
- 141Habitat MutualismOne partner provides the other with shelter or living space
- 142Service MutualismOne partner performs and ecological service for the other, ie, pollination
- 143Taxonomic AffinityGrouping species by taxonomy, ie, all bird species in a community
- 144GuildGroup of species that use the same resource
- 145Functional GroupSpecies that function similarly but don't necessarily use the same resource
- 146Species RichnessNumber of species in a community
- 147Species EvennessRelative abundances of species compared with each other
- 148Species DiversityCombines species richness + species evenness
- 149Shannon IndexMeasure of species diversity.
H = pi(ln(pi))
pi = proportion of individuals in ith species - 150BiodiversityDescribes diversity at multiple spatial scales, from genes to species to communities. Implies the interconnectedness of all components.
- 151Rank Abundance Curves
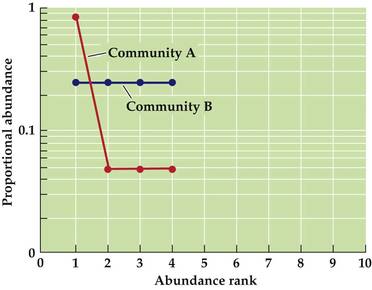
- 152Species Accumulation Curves
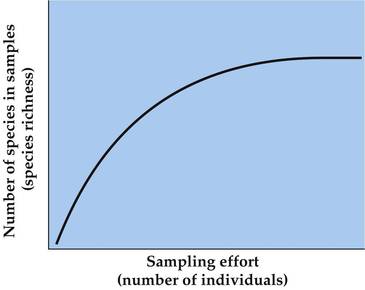
- 153Trophic FacilitationA consumer is indirectly facilitated by a positive interaction between its prey and another species
- 154Competitive NetworksCompetitive interactions among multiple species in which every species negatively interacts with every other species
- 155Interaction StrengthMagnitude of the effect of one species on the abundance of another species. Measured by removing one species (interactor) and observing effect on other species (target).
- 156Dominant/Foundation SpeciesHave large effects on other species and species diversity by virtue of their considerable abundance or biomass
- 157Keystone SpeciesHave strong effects because of their roles in a community, but are small in terms of overall biomas
- 158SuccessionDirectional change in species composition over time as a result of biotic and abiotic agents of change
- 159Primary SuccessionColonization of habitats devoid of life
- 160Secondary SuccessionRe-establishment of a community in which some but not all organisms have been destroyed
- 161Climax CommunityStable end point composed of dominant species that persist over many years, and can be maintained indefinitely.
- 162Agents of Change
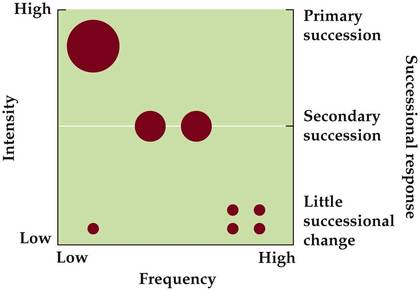
- 163Facilitation ModelEarly species modify the environment in ways that benefit later species. Sequence of species facilitations leads to a climax community
- 164Tolerance ModelAlso assumes earliest species modify the environment, but in neutral ways that neither benefit nor inhibit later species
- 165Inhibition ModelAssumes early species modify conditions in negative ways that hinder later successional species
- 166Alternative Stable StatesDifferent communities follow different successional paths develop in the same area under similar environmental conditions
A community is stable when it returns to its original state after some perturbation - 167Stable States
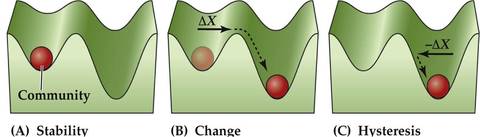
- 168HysteresisInability to shift back to original community type, even when original conditions are restored
- 169BiogeographyStudy of patterns of species composition and diversity across geographic locations
- 170Regional Species PoolAll species contained within a region (gamma diversity)
- 171Alpha DiversityDiversity within a community
- 172Beta DiversityChange in species number and composition from one community to another
- 173Global Patterns1. There is a gradient of species diversity with latitude
2. Earth's landmass can be divided into 6 biogeographic regions - 174VicarianceEvolutionary separation of species by barriers such as those formed by continental drift
- 175Species Diversification RateTropics have most land area and stable temperatures, and so extinction rates are lower and separation by geographic isolation is more likely
- 176Species Diversification
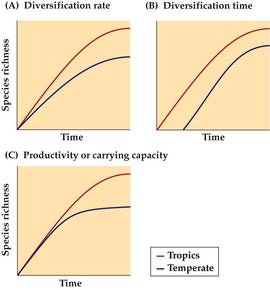
- 177Species Diversification TimeTropics are more climatically stable over time, and so species have more time to evolve. Also species likely originated in tropics and dispersed outwards.
- 178Productivity/Carrying CapacityProductivity is highest in tropics, which promotes large population sizes and lower extinction rates, and overall increases species richness
- 179Species-Area RelationshipSpecies richness increases with area sampled.
S=zA + c
S = species richness z = slope c = y-intercept
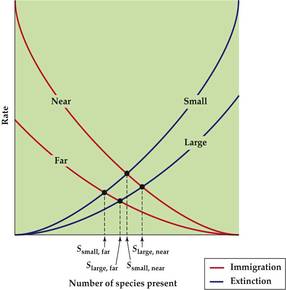
A = area of sample - 180Equilibrium Theory of Island BiogeographyNumber of species on an island depends on balance between immigration and extinction rates
- 181Equilibrium Theory of Island Biogeography
- 182Edge EffectsCaused by habitat fragmentation. Trees at edge are exposed to more wind, more light, increased temp, etc. This can contribute to local extinctions.
- 183Biotic ResistanceOccurs when interactions with native species excludes an invader.
- 184Resource Ration HypothesisSpecies coexist by using resources in different proportions
- 185Coexistencem
- 186Intermediate Distance HypothesisSpecies diversity should be greatest at intermediate disturbance. At lower disturbances, competition determines diversity, and at high disturbance, many species can't survive.
- 187Intermediate Disturbance Hypothesisj
- 188Complimentary HypothesisAs species richness increases, there is a linear increase in community function
- 189Redundancy HypothesisThe functional contribution of additional species reaches a threshold
- 190Driver and Passenger HypothesisDriver species have large effects and passenger species have minimal effects
- 191Overlap Between Driver and Passenger Functiond
- 192Primary ProductionAmount of energy produced by autotrophs
- 193Primary ProductivityRate of primary production
- 194Gross Primary Production (GPP)Total amount of C fixed by autotrophs. Depends on photosynthetic rate.
- 195Leaf Area IndexLeaf area per unit of ground area. Influences GPP.
- 196Net Ecosystem Production/ExchangeNet change in CO2 = GPP-total respiration
A more refined estimate of ecosystem C storage. - 197Net Secondary ProductionIngestion-respiration-egestion
- 198Allochthenous InputsExternal energy inputs.
- 199Autochthenous InputsEnergy produced by autotrophs within a system
- 200Terrestrial Trophic Pyramidm
- 201Aquatic Trophic Pyramidm
- 202Trophic EfficiencyAmount of energy at one trophic level divided by amount of energy at the trophic level directly below it.
- 203Consumption EfficiencyProportion of available energy that is consumed
- 204Assimilation EfficiencyProportion of ingested foods that is assimilated
- 205Production EfficiencyProportion of assimilated food that goes into new consumer biomass
- 206BioaccumulationChemicals that become progressively more concentrated in tissues over an organism's lifetime
- 207BiomagnificationConcentration of chemicals increases in animals at higher trophic levels
- 208BiogeochemistryStudy of physical, chemical and biological factors that influence movement and transformation of elements
- 209Cation Exchange Capacityability of a soil to hold and exchange cations
- 210NitrificationNH3 + NH4 -> NO3 in aerobic conditions
- 211DenitrificationNO3 -> N2 + N2O in anoxic conditions
- 212Mean Residence Time (Turnover Rate)Amount of time on average a molecule spends in a pool.
=total pool of element/rate of input - 213OcclusionInsoluble compounds that are unavailable as nutrients
- 214Extinction VortexA small population declines even further and becomes more vulnerable to processes that lead to extinction
- 215Taxonomic HomogenizationDecline of native specialists and spread of introduced species and native generalists.
- 216Carbon CycleMajor Pools of C: atmosphere, oceans, land surface, vegetation, and rocks.
Sediment and rock is largest pool and most stable - 217Nitrogen CycleOften limits primary productivity. Largest N pool is atmospheric.
- 218Phosphorous CycleP can be limiting to primary productivity in aquatic ecosystems and some terrestrial ecosystems. Largest pool is terrestrial soil and marine sediment.
Information
- Description
- Flashcards on Untitled, created by mgm_pianogirl on 12/12/2013.
- Created by
- mgm_pianogirl
- Views
- 8
- Rating