
Mind map
Data analysis, interpretation, and presentation
Map content
Data analysis, interpretation, and presentation
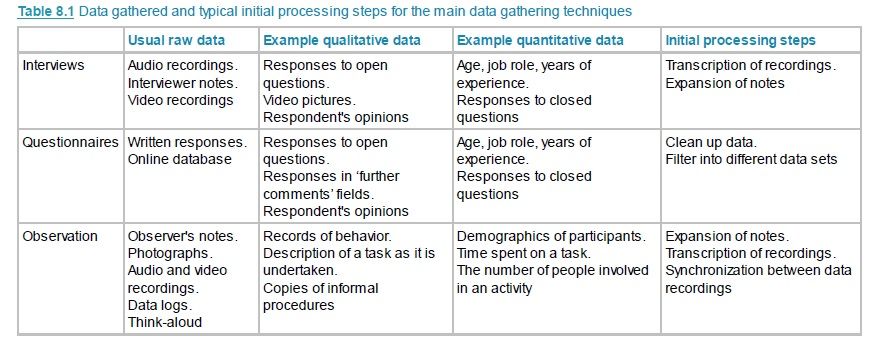
Qualitative and Quantitative
- Quantitative
- Numbers
- Qualitative
- Descriptions
- Quantitative
Simple Quantitative Analysis
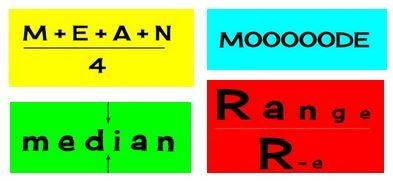
- Average
- Mean
- Median
- Mode
- Percentage
- Useful for standardizing
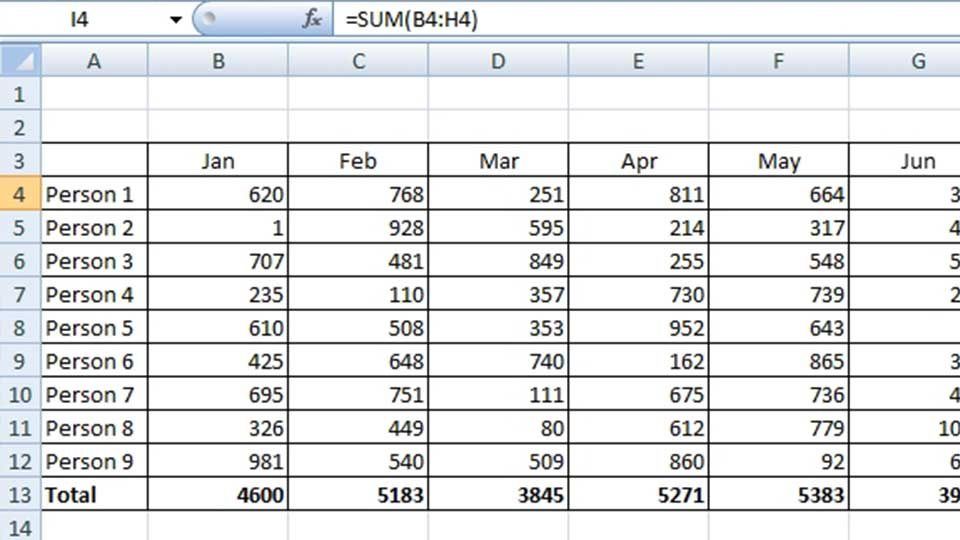
- Typically arranged in rows and columns
- Excel
- Spreadsheets
- Graphs
- Excel
- Average
Simple Qualitative Analysis
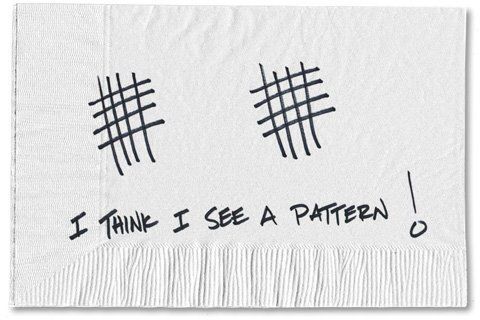
- Identify recurring patterns or themes
- Categorizing data
- Data into elements and then into categories
- Follow a scheme
- Analyzing critical incidents
- Identify significant incidents and focus and analyze them in detail
Tools to Support Data Analysis
- Atlas.ti
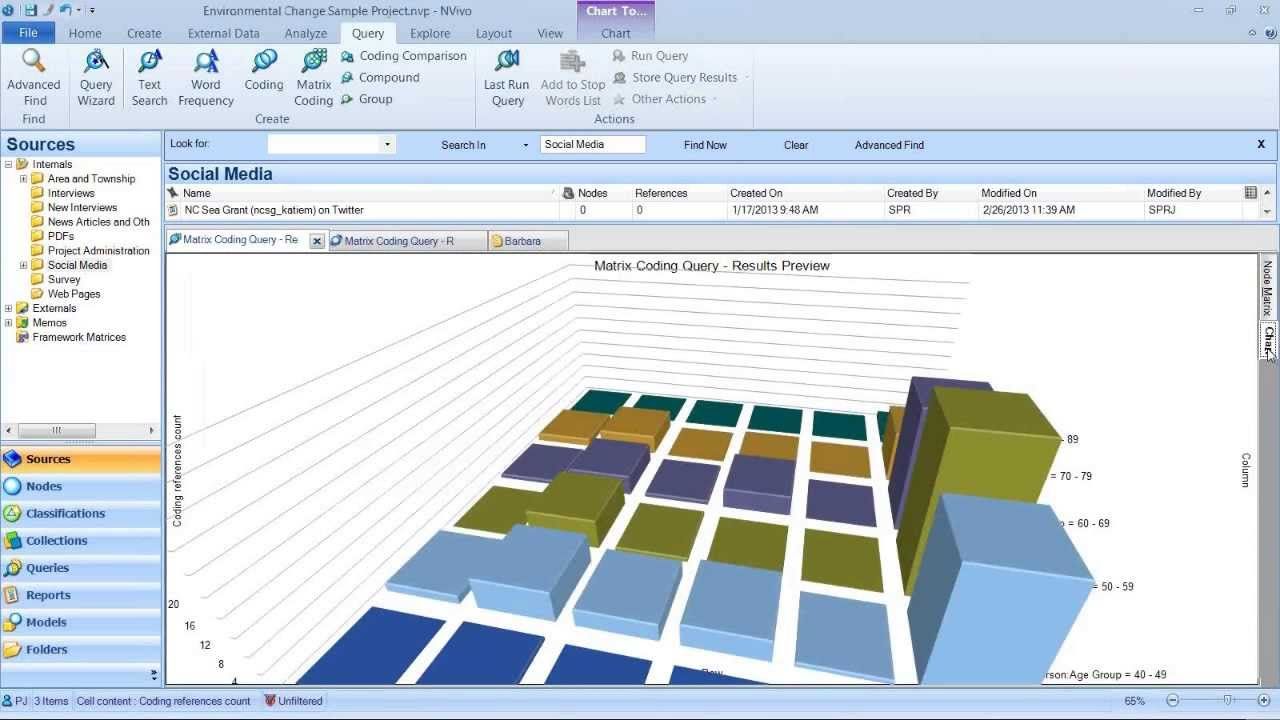
- Nvivo
- SPSS
Using Theoretical Frameworks
- Grounded Theory
- Qualitative
- Data is needed to develop the theory
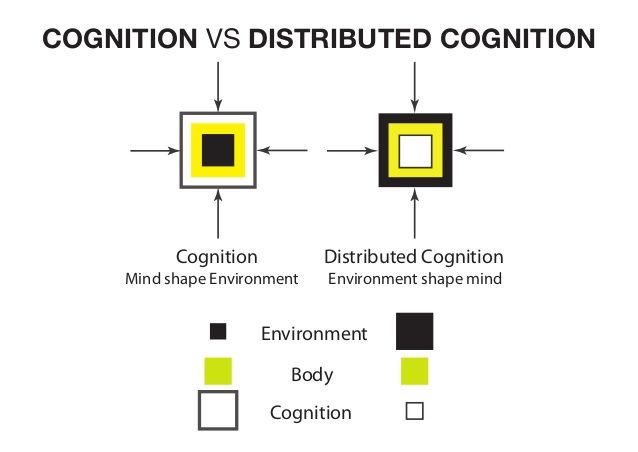
- Distributed Cognition
- Emphasizes info and its propagation through the cognitive system under study
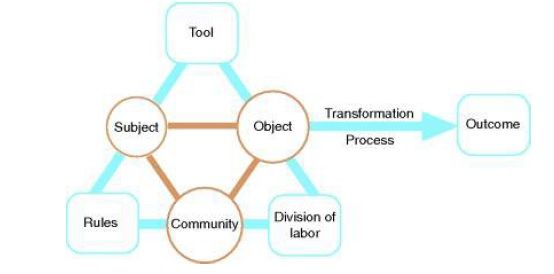
- Activity Theory
- Focuses around the concept of an activity
- Individual model
- Hierarchical
- Artifactual model
- Physical or abstract concepts
- Individual model
- Focuses around the concept of an activity
- Grounded Theory
Presenting the findings
- Rigorous notations
- Clear syntax and semantics
- Storytelling
- Summarizing
- Rigorous notations
Images and files in the map




Information
- Description
- Mind Map on Data analysis, interpretation, and presentation, created by Katya Treviño on 09/10/2017.
- Created by
- Katya Treviño · Oct 2017
- Updated
- Oct 9, 2017
- Views
- 1
- Rating