
Mind map
Data analysis
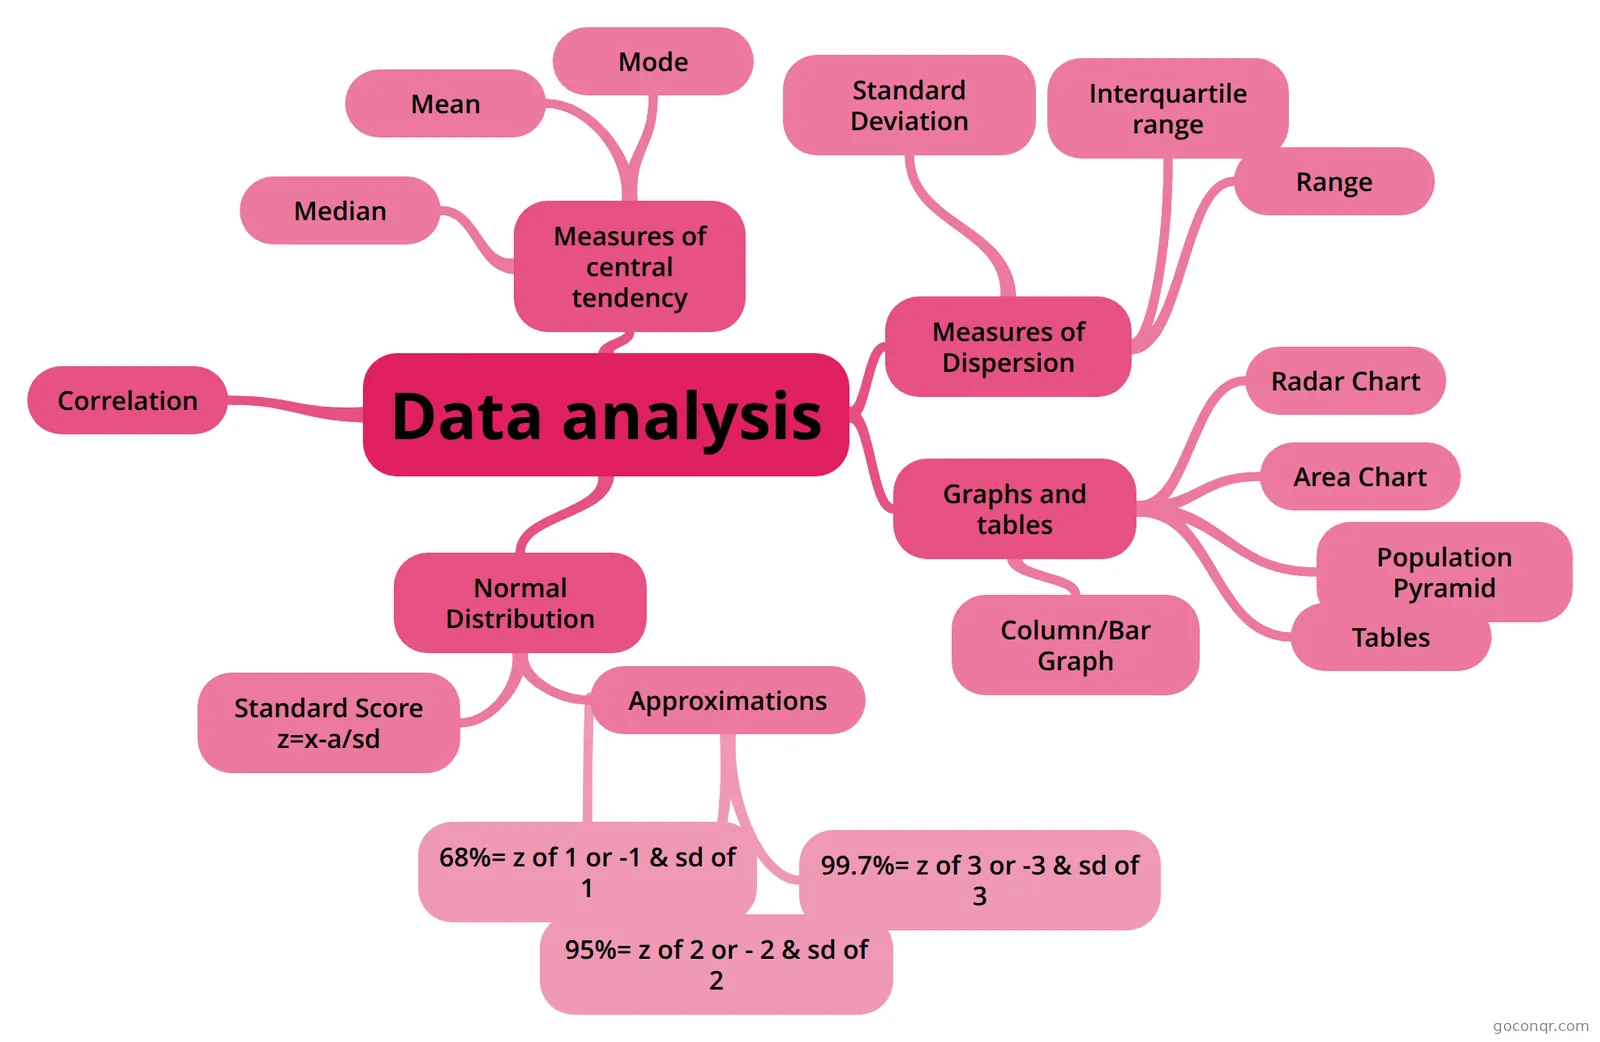
Mind map: data analysis
Map content
Data analysis
Measures of central tendency
- Mode
- Mean
- Median
Measures of Dispersion
- Range
- Interquartile range
- Standard Deviation
Graphs and tables
- Column/Bar Graph
- Tables
- Radar Chart
- Area Chart
- Population Pyramid
Normal Distribution
- Standard Score z=x-a/sd
- Approximations
- 68%= z of 1 or -1 & sd of 1
- 95%= z of 2 or - 2 & sd of 2
- 99.7%= z of 3 or -3 & sd of 3
Correlation
Information
- Description
- HSC Maths Mind Map on Data analysis, created by Skye Boulton on 03/08/2013.
- Created by
- Skye Boulton
- Views
- 88
- Tags
- Rating