
Mind map
Histograms and frequency density
Map content
Histograms and frequency density
histogram = bar chart where the bars can be different widths
y axis = frequency density
- frequency density = frequency / class width
- frequency = frequency density x class width = area of bar
- frequency density = frequency / class width
Example
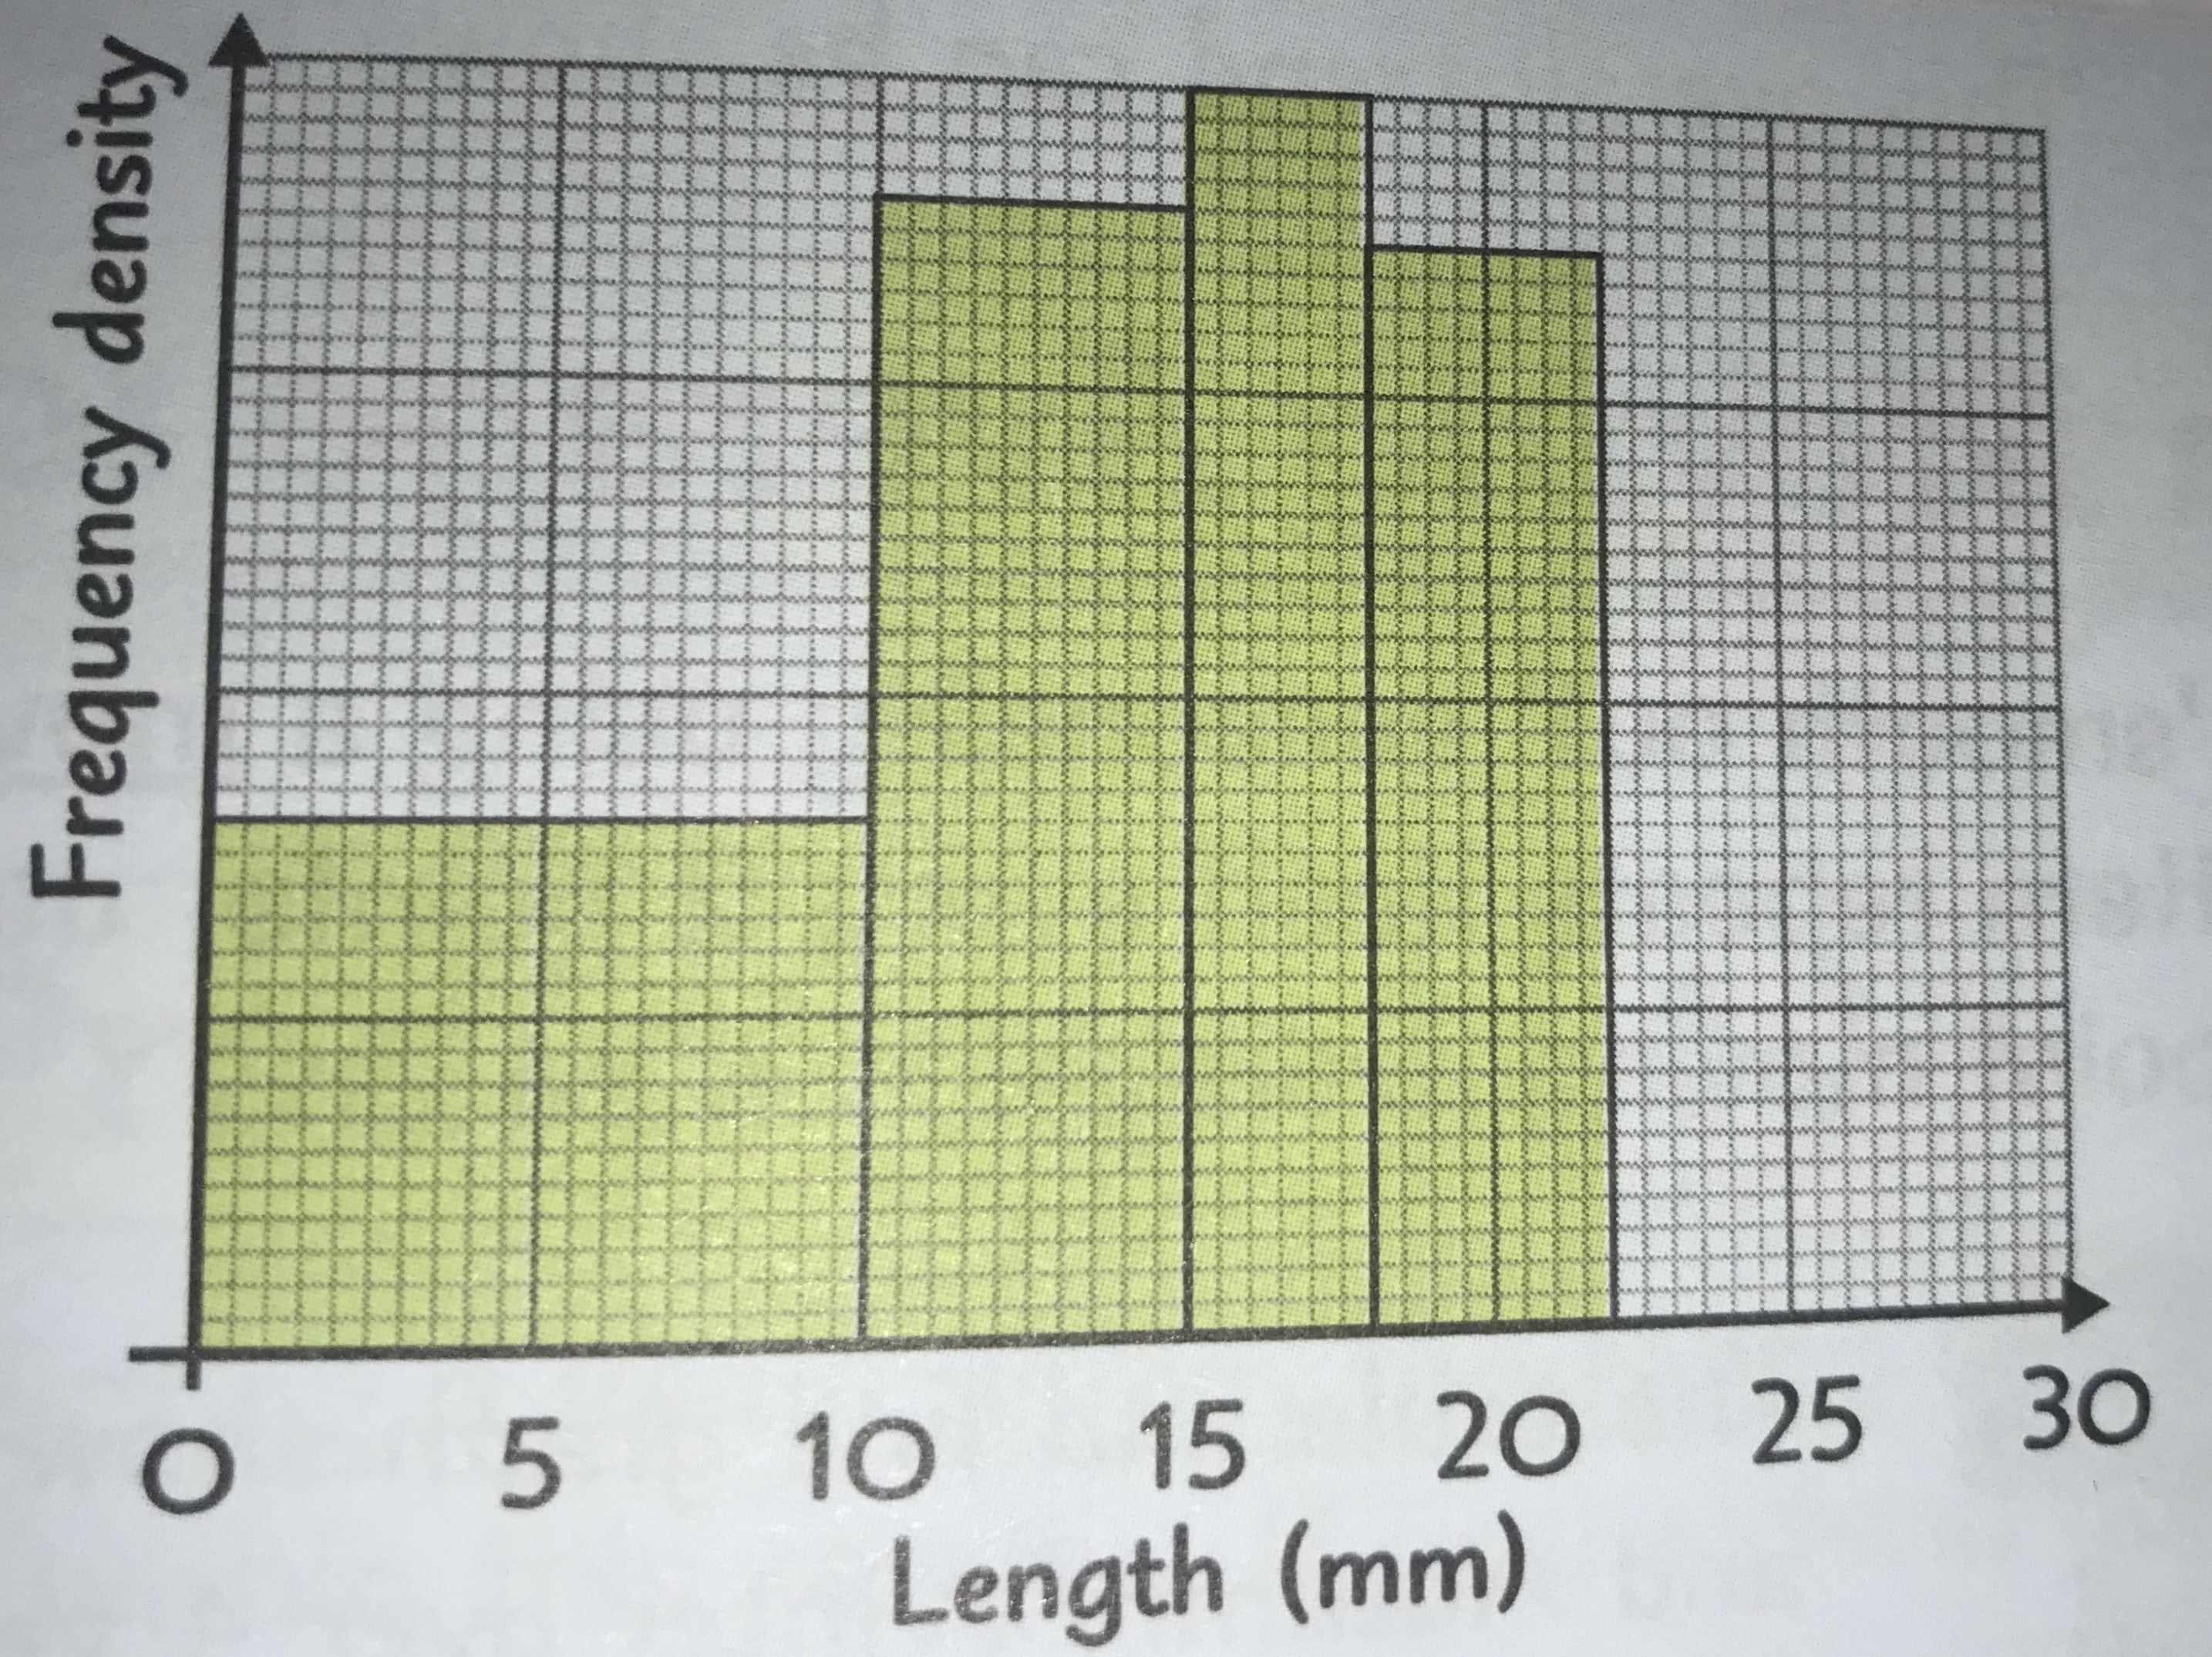
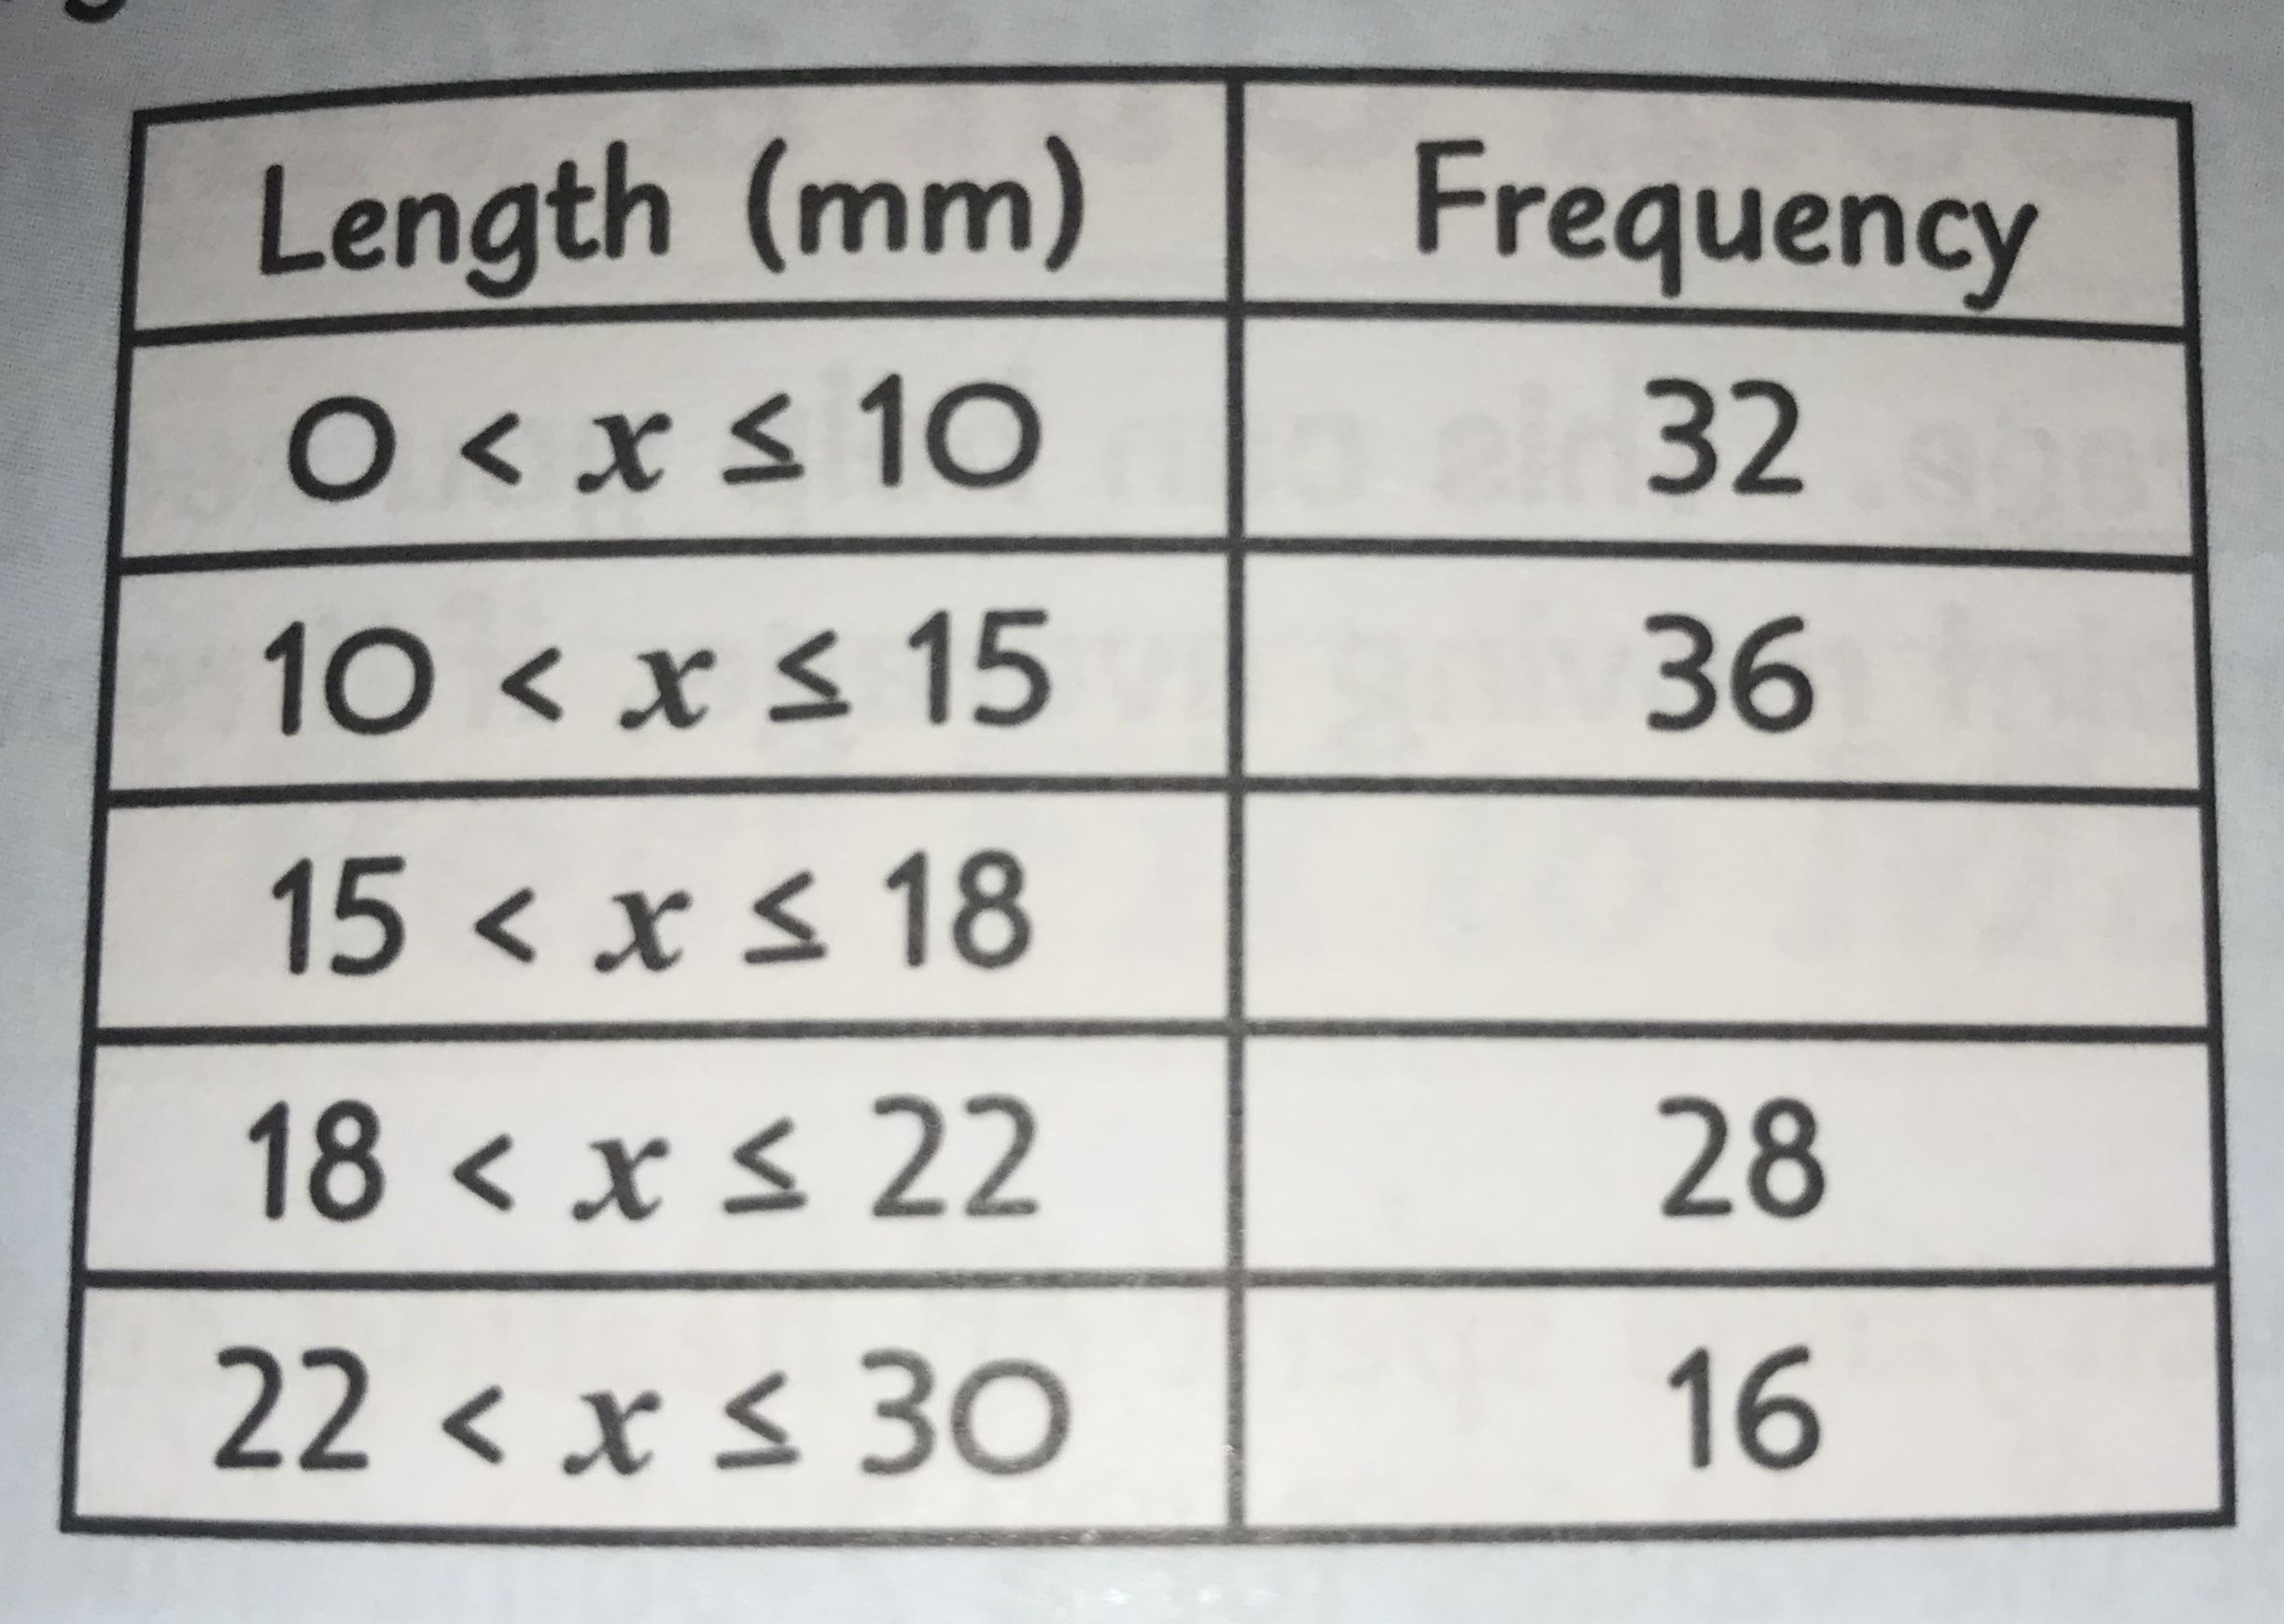
- this table and histogram show the lengths of beetles in a garden
- use the histogram to find the missing entry in the table
- the frequency = the frequency density x the class width
- so 18 - 15 = 3 = class width
- frequency density = 8
- 8 x 3 = 24
- the missing value is 24
- 8 x 3 = 24
- frequency density = 8
- so 18 - 15 = 3 = class width
- the frequency = the frequency density x the class width
- use the histogram to find the missing entry in the table
- this table and histogram show the lengths of beetles in a garden
Images and files in the map
Information
- Description
- GCSE Maths (probability and statistics) Mind Map on Histograms and frequency density, created by lizabeth rawson on 30/10/2019.
- Created by
- lizabeth rawson
- Views
- 33
- Rating