
Mind map
Quality
Map content
Quality
Topic 2
- Quality Methodology
- Stages of quality
- 1.Artisanal stage
- The objective of the craftsman was personal satisfaction and that of the buyer.
- 2.Industrialization stage
- The objective was to satisfy the demand for goods, since in the past products were scarce, as well as to increase profits.
- 3. Inspection stage
- At this stage they prioritized meeting customer specifications over the quantity of products manufactured.
- 4. Statistical process control
- This would be done by identifying or rejecting products at each stage before reaching the final stage.
- 5. Quality assurance
- . It became necessary to adjust the entire process to the available means to ensure product reliability and shelf life.
- 6. Continuous improvement
- It allows to get what the customer is looking for, what is programmed, to manufacture the same and to look for the total quality.
- 1.Artisanal stage
- Stages of quality
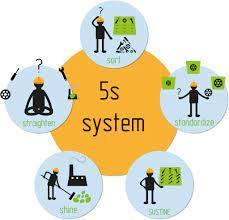
- 5,s
- Sorting
- Identify and separate unnecessary materials and discard them.
- order
- The necessary materials are located and identified so that they can be easily and quickly found, used and replenished.
- cleaning
- : Sources of dirt are identified and eliminated to ensure that they are always in perfect condition.
- standardization
- : Its objective is to distinguish a normal situation from an abnormal one by means of simple rules that are visible to all.
- Discipline
- Consists of working permanently according to the established norms.
- Sorting
- Quality Methodology
Topic 3
- Customer service Fundamentals
- NATURE AND QUALITY OF SERVICES
- refers to the attributes that characterize the service Intangibility (cannot be touched), security, speed, effectiveness, etc.
- SERVICE AND ITS FEATURES
- A service is an activity or a series of activities carried out by a provider with the purpose of satisfying a certain customer need, its basic characteristics are intangibility, heterogeneity, inseparability and perishability.
- DIMENSIONS OF THE QUALITY OF SERVICE
- Dimensions of Service Quality (attributes): it is composed of several attributes or dimensions both objective and subjective. For example, in a customer service, some attributes are fundamental such as: Availability, Accessibility, Courtesy, Agility, Trust, Competence, Communicability
- Reliability
- It is the ability to offer a service in an accurate, safe and conscious way.
- Answer
- It is the ability to provide timely service.
- Security
- Knowledge and courtesy of employees, as well as the ability to convey security.
- Empathy
- Personalized and careful attention to customers.
- Tangible
- Physical aspects of the service.
- Reliability
- Dimensions of Service Quality (attributes): it is composed of several attributes or dimensions both objective and subjective. For example, in a customer service, some attributes are fundamental such as: Availability, Accessibility, Courtesy, Agility, Trust, Competence, Communicability
- NATURE AND QUALITY OF SERVICES
- Poka-Yoke
- The poka-yoke method is a Japanese technique used to avoid mistakes in a company's operations. Its translation means "error-proof" or "avoid inadvertent errors".
- The poka-yoke method was devised to prevent human error. Within the lean manufacturing vision, it is considered as a quality tool that, therefore, seeks to increase the quality of the products produced and increase their level of efficiency.
- Customer service Fundamentals
Topic1
- Deming Cycle
- The Deming cycle is a system that seeks the constant optimization of business activities through four stages. Once the last stage is reached, the company must start over, thus promoting a continuous self-evaluation that allows it to identify opportunities for improvement in each process.
- PLAN-Is the first stage of the Deming cycle and is where the problem is identified, objectives are created to solve it (such as SMART) and the duties to achieve those objectives are designated.
- DO-In the second stage of the PHVA cycle, employees start working on the changes to achieve the proposed objectives, under previous instructions. In this process it is advisable to keep the team supervised and, if necessary, to do a pilot test.
- CHECK-After a previously defined period of time has elapsed since the activities are started, in the third stage of the Deming cycle, the results are evaluated based on the KPIs selected for each objective. This analysis verifies the efficiency and effecttiveness of the actions taken.
- ACT-in the "last" stage of the Deming cycle, decisions are made based on the learning obtained. If there were failures, corrective actions are defined. If, on the other hand, the results were optimal, the change is documented and integrated into the business processes.
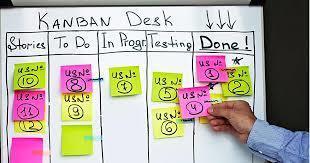
- Kanban
- Kanban is a visual system for managing work as it moves through a process. Kanban visualizes both the process (the workflow) and the actual work going through that process. The goal of Kanban is to identify potential bottlenecks in the process and resolve them so that work can flow through the process cost-effectively and at optimal speed or throughput.
- The first Kanban system was developed by Taiichi Ohno (industrial engineer and entrepreneur) for the Toyota automobile company in Japan. It was created as a simple planning system, the aim of which was to optimally control and manage work and stock at each stage of production
- On a board, a "Kanban card" represents a task, and this task card advances through the stages of the work as it is completed.
- Kanban is a visual system for managing work as it moves through a process. Kanban visualizes both the process (the workflow) and the actual work going through that process. The goal of Kanban is to identify potential bottlenecks in the process and resolve them so that work can flow through the process cost-effectively and at optimal speed or throughput.
- Deming Cycle
Topic 4
- Quality- Customer Service
- Flexibility in Distribution
- Flexibility in manufacturing is a complex and multidimentional concept that represents the ability or ability of a production system to successfully adapt to changing environmental conditions, process and customer needs without incurring great penaltirs of time.
- Customer Information Systems
- Informing the customer about the company is a primary function of the customer service area. This department functions as the face of the company, and this is how it is perceived by users.
- Technical Suport
- The objectives of technicval supportead us to a need that provides many advantages for the company, regardless of the type, service and requirements of this, such as,optimize and improve the performance of your technological products or service
- Evaluation of Customer Satisfaction
- The evaluation of a customer satisfaction atudy is suppoted by a descriptive analysis. Mean values and frequencies are calculated and the distribution of responsesis described by variance and standar deviation.
- Kaiezen Method
- This tool is based on making gradual improvements, trhat is, instead os making a radical change, small actions are made that are carried out in an orderly manner ev ery day and that allow you leave the confort zone
- The Kaisen Method is very popular at the enterprise level, as all members of the organization are involved in the development process, which translates into increased performance and productivity-
- Actions to develop the plan
- Plan
- Apply
- Verify
- Excute
- Actions to develop the plan
- The Kaisen Method is very popular at the enterprise level, as all members of the organization are involved in the development process, which translates into increased performance and productivity-
- This tool is based on making gradual improvements, trhat is, instead os making a radical change, small actions are made that are carried out in an orderly manner ev ery day and that allow you leave the confort zone
- Flexibility in Distribution
- Quality- Customer Service
Topic 5
- Elements of customer Service
- AVAILABILITY OF PRODUCT AND SERVICE
- Instead, product availability refers to having access to inventory whenever the customer needs it.
- DELIVERY
- it is the moment in which the client or consumer receives their order, which has gone through the entire prior logistics process that has allowed it to arrive from the factory or point of production to the client's hands
- ORDER CYCLE
- . Understanding total order cycle time is extremely important, as longer order cycles have been shown to have a negative impact on a business's ability to attract and retain customers.
- DELIVERY FREQUENCY
- Thus, shorter delivery times do not always translate into higher profits, but they almost always increase customer satisfaction.
- CUSTOMER DELIVERY
- The delivery to the client is the moment of dispatch of the order. In other words, it is the moment in which the client or consumer receives their order, which has gone through the entire prior logistics process that has allowed it to arrive from the factory or point of production to the client's hands.
- AVAILABILITY OF PRODUCT AND SERVICE
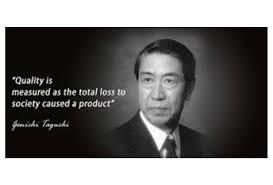
- Taguchi-s Method
- The Taguchi method is exposed as an efficient tool for the design and optimization of processes and products, because it focuses on the identification and evaluation of the variables with the greatest influence on the output of the process, on the reduction of the effects of the factors uncontrollable and in reducing process performance variation
- The Taguchi method is exposed as an efficient tool for the design and optimization of processes and products, because it focuses on the identification and evaluation of the variables with the greatest influence on the output of the process, on the reduction of the effects of the factors uncontrollable and in reducing process performance variation
- Elements of customer Service
Topic 6
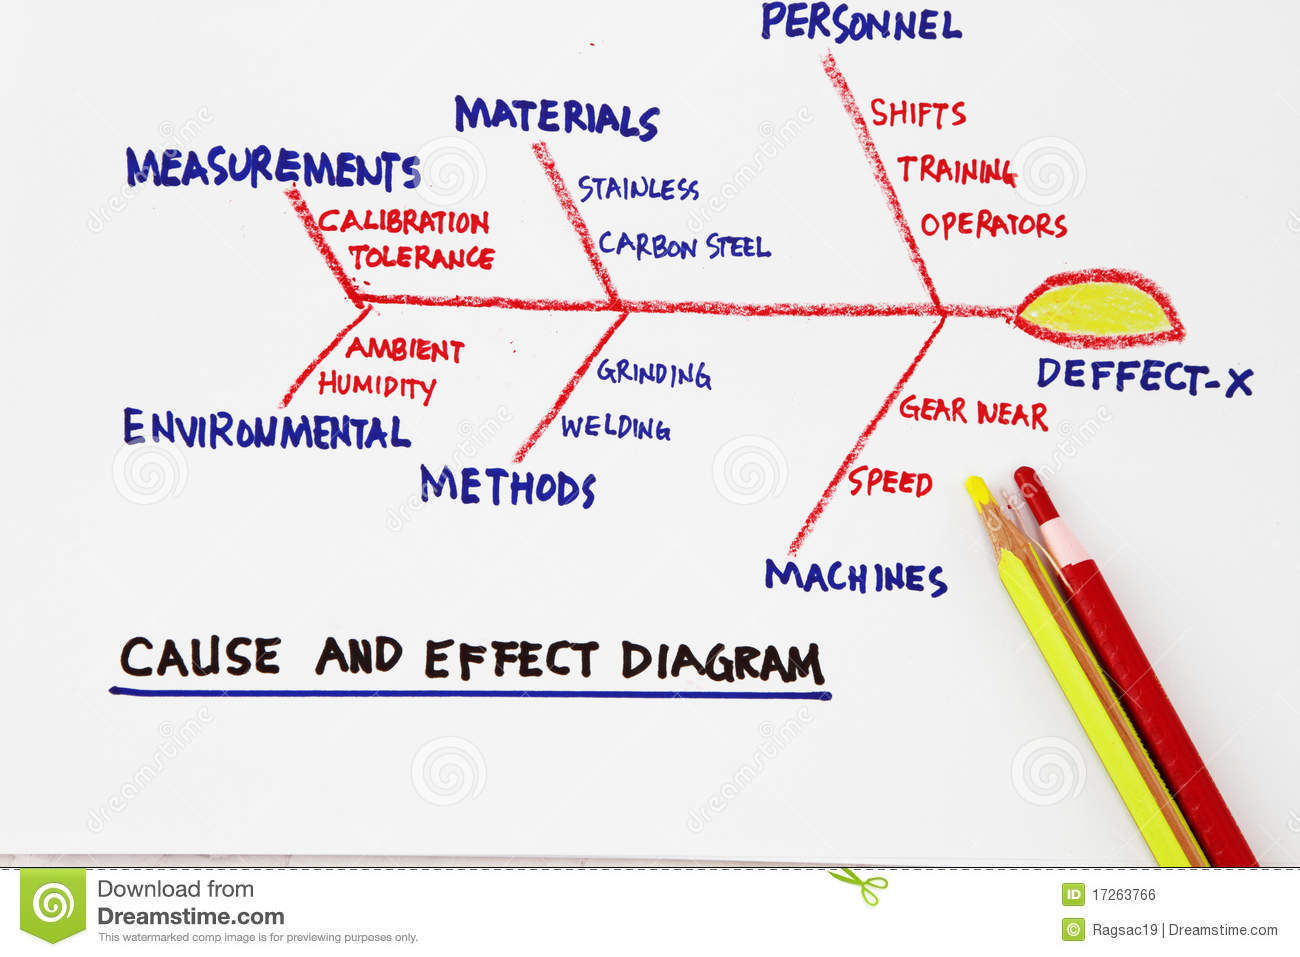
- CAUSE-EFFECT DIAGRAM
- The Cause and Effect Diagram is used to identify the possible causes of a specific problem
- It is built following the following steps:
- 4. Plot the main causes in obliques to the center arrow.
- 3. Identify the categories, contributing factors or main causes (the most common used are: equipment, method, personnel, user, although you can place other categories according to the problem that is being worked
- 2. Draw the fish skeleton diagram by placing the problem in the box on the right.
- 1. Develop a clear statement of the problems.
- 5. When it is possible to determine the causes of 2nd and 3rd level according to each element analyzed, they are plotted as oblique to the categories.
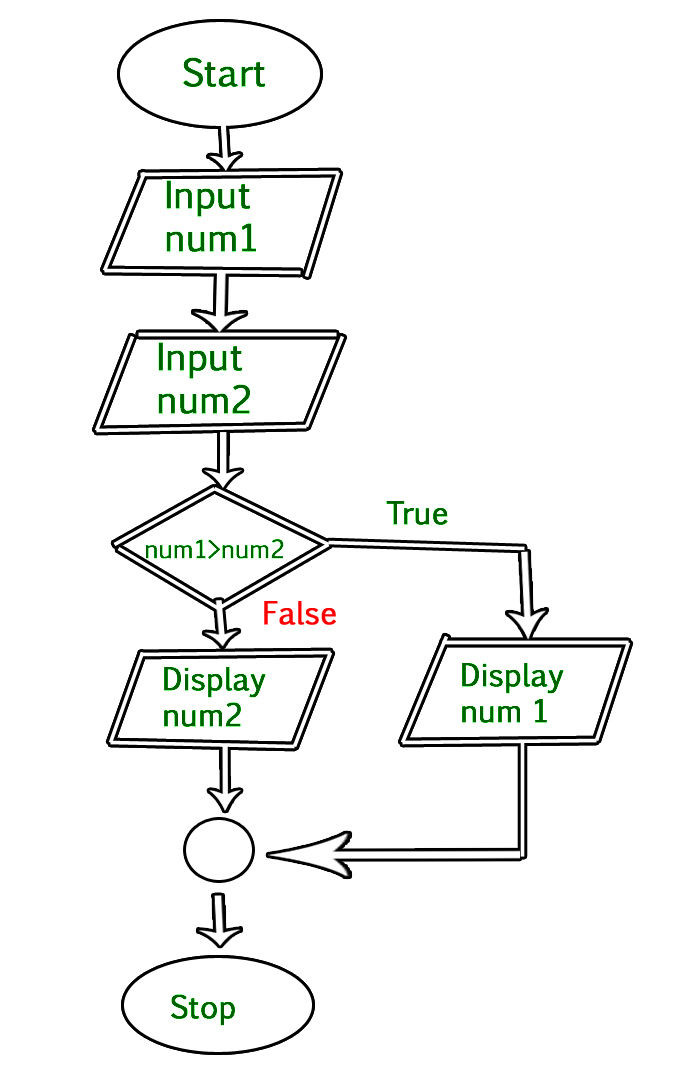
- FLOW CHART
- The flowchart or flowchart or activity diagram is the graphical representation of an algorithm or process. It is used in disciplines such as programming, economics, industrial processes and cognitive psychology.
- As flowcharts are very powerful tools, they are used in many fields and market sectors. You can see them in education, sales and marketing, business, engineering, or manufacturing. Flowcharts can be found virtually anywhere. Depending on the type of process you intend to visualize
- The following are actions prior to the realization of the flowchart
- Define what you expect to get from the flowchart.
- Identify who will use it and how.
- Set the required level of detail.
- Determine the limits of the process to be described.
- Just in time
- Origin and operation of the Just in Time System (JIT)
- The objective with which this system emerged was simple, to eliminate or reduce any element that did not add value from the production process.
- With this system, we go from a “Push” type system in which each phase of the chain accumulates its production until it is required By the next phase, to a “Pull” system in which each phase is the one who requests the next phase. up the supply chain the required quantity, and in this way only what is needed is produced.
- The "Just in time" system applied to logistics directly affects the stock management process, order preparation, transport management and customer and after-sales service.
- Warehouses or warehouses must be strategically located to fulfill their function within the supply chain, either at the manufacturing site or at an intermediate point for distribution.
- advantages
- Reduction of the stock level of stocks. Only the necessary quantity requested by the next phase in the chain is produced
- Expiration or deterioration of products stored for excessive time is avoided
- Loading and unloading times of merchandise are reduced.
- Reduction of storage and inventory costs and therefore improvement of the competitiveness of companies.
- Disadvantages
- An erroneous implementation of the Just in Time system can lead to delays or lack of stock
- Requires great coordination and communication between customers and suppliers
- Purchasing in smaller quantities is likely to result in higher purchase prices from the supplier.
- Origin and operation of the Just in Time System (JIT)
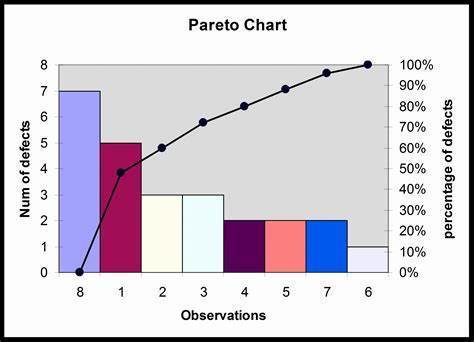
- Pareto Chart
- is a graph that shows defects in the products of an industrial process, with their frequency and the degree to which they affect customer satisfaction. It was proposed by the Italian economist Vilfredo Pareto in the early twentieth century, and is governed by a rule found in a variety of situations: the 80/20 rule.
- -Characteristics of a Pareto Chart
- It is a technique of simple calculations.
- Analyze the characteristics of a group and recognize the most important points within it to give them priority.
- It allows you to make objective decisions that are based on data and not on personal opinions.
- Analyze the elements and how often each of the data happens.
- How to create a Pareto Chart?
- Research what the problem is, collect the data, and select what will be analyzed.
- Prioritize information from highest to lowest.
- Structure the data in a table from highest to lowest and calculate the percentage of each.
- Plot the graph. First the vertical and horizontal axes, then draw the left vertical line for frequency.
- Draw one for each group from highest to lowest.
- CAUSE-EFFECT DIAGRAM
Images and files in the map
Information
- Description
- Mind Map on Quality, created by Ramiro Ernesto Vazquez Rodriguez on 16/11/2022.
- Created by
- Ramiro Ernesto Vazquez Rodriguez
- Views
- 1
- Rating