
Mind map
Darstellung funktionaler Zusammenhänge
Map content
Darstellung funktionaler Zusammenhänge
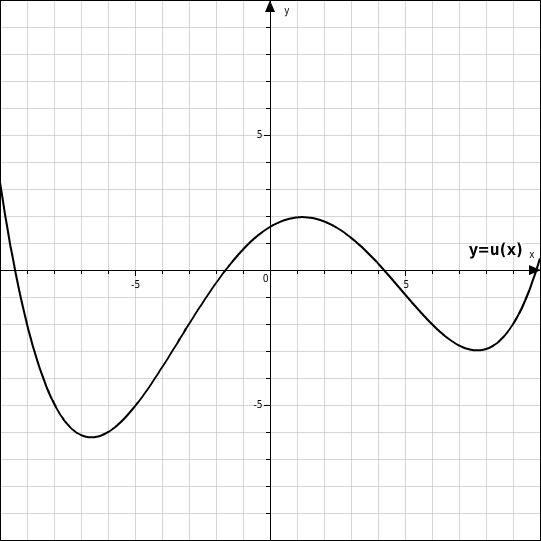
Funktionsgraph
- Graph einer Funktion f
- Besteht aus Wertpaaren (x;y)
- y
- y=f (x)
- kann mehrere x-Werte zugeteilt haben
- x
- kann nur einen y-Wert zugeteilt haben
- y
- Besteht aus Wertpaaren (x;y)
- Graphische Darstellung zur Weltetabelle: Argumente und Funktionswerte von Graphen ablesen und in eine Tabelle einsetzen
- Graph einer Funktion f
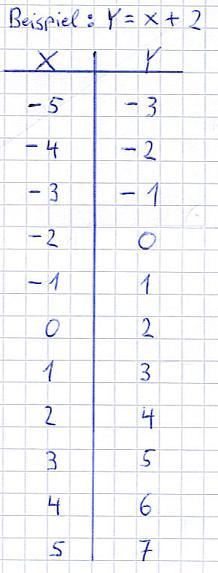
Wertetabelle
- Tabelle mit zwei Spalten
- Argument
- Funktionswert
- Wertetabelle in Graphischer Darsetllung: Werte als Punkte in ein Koordinatensystem einzeichnen und anschließend verbinden
- Tabelle mit zwei Spalten
Images and files in the map
Information
- Description
- 9. Klasse Mathematik Mind Map on Darstellung funktionaler Zusammenhänge, created by Christoph Wurm on 23/02/2017.
- Created by
- Christoph Wurm
- Views
- 84
- Rating