
Mind map
Climate Change
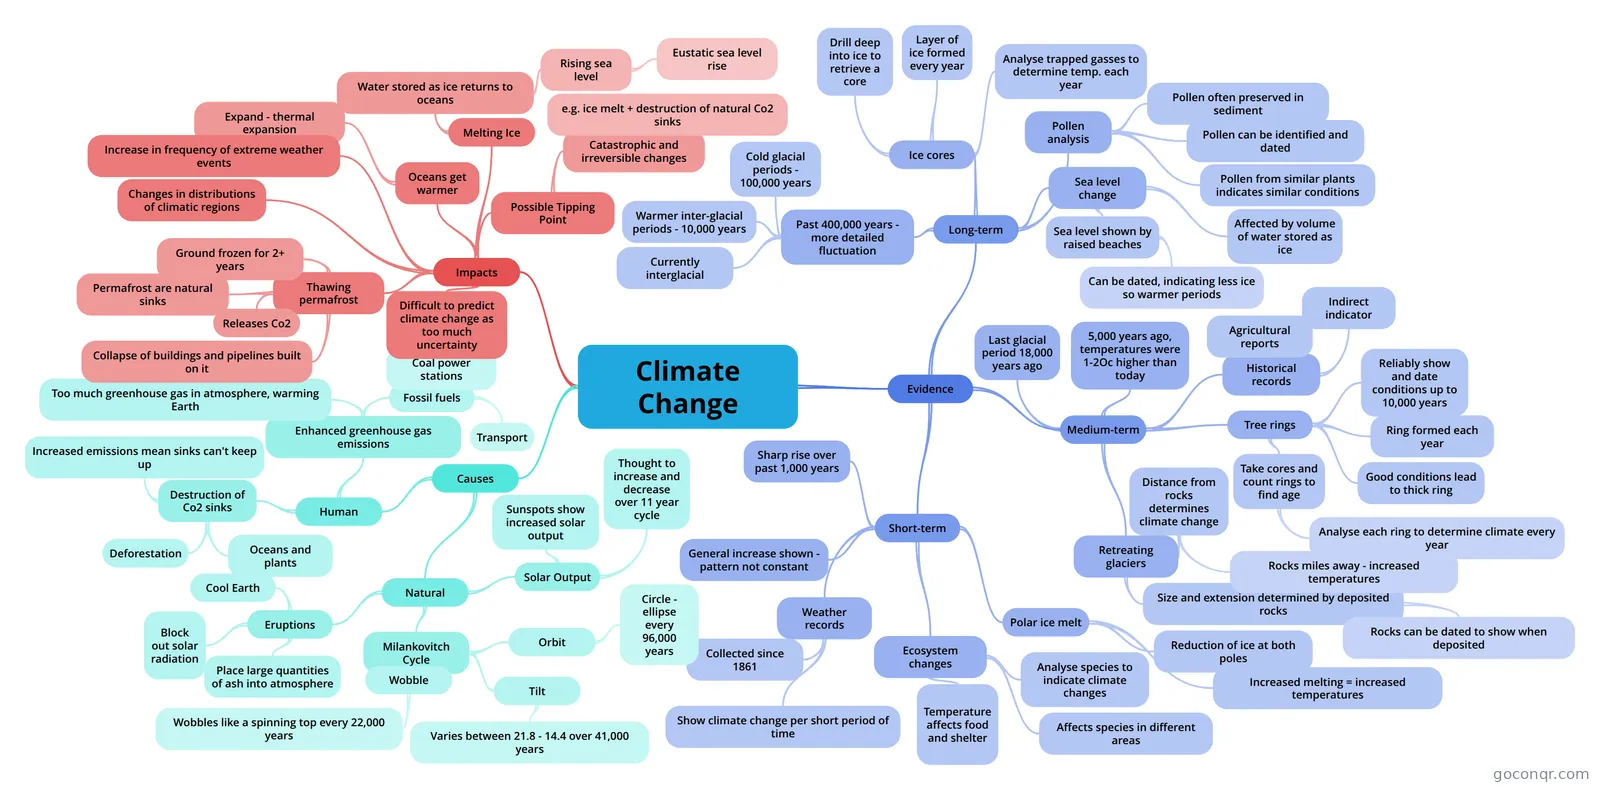
Mind map: Climate change
Map content
Climate Change
Evidence
- Long-term
- Past 400,000 years - more detailed fluctuation
- Cold glacial periods - 100,000 years
- Warmer inter-glacial periods - 10,000 years
- Currently interglacial
- Ice cores
- Layer of ice formed every year
- Drill deep into ice to retrieve a core
- Analyse trapped gasses to determine temp. each year
- Pollen analysis
- Pollen often preserved in sediment
- Pollen can be identified and dated
- Pollen from similar plants indicates similar conditions
- Sea level change
- Affected by volume of water stored as ice
- Sea level shown by raised beaches
- Can be dated, indicating less ice so warmer periods
- Past 400,000 years - more detailed fluctuation
- Medium-term
- Last glacial period 18,000 years ago
- 5,000 years ago, temperatures were 1-2Oc higher than today
- Historical records
- Agricultural reports
- Indirect indicator
- Tree rings
- Ring formed each year
- Good conditions lead to thick ring
- Take cores and count rings to find age
- Analyse each ring to determine climate every year
- Reliably show and date conditions up to 10,000 years
- Retreating glaciers
- Size and extension determined by deposited rocks
- Rocks can be dated to show when deposited
- Distance from rocks determines climate change
- Rocks miles away - increased temperatures
- Size and extension determined by deposited rocks
- Short-term
- Sharp rise over past 1,000 years
- General increase shown - pattern not constant
- Weather records
- Collected since 1861
- Show climate change per short period of time
- Polar ice melt
- Reduction of ice at both poles
- Increased melting = increased temperatures
- Ecosystem changes
- Temperature affects food and shelter
- Affects species in different areas
- Analyse species to indicate climate changes
- Long-term
Causes
- Natural
- Milankovitch Cycle
- Orbit
- Circle - ellipse every 96,000 years
- Tilt
- Varies between 21.8 - 14.4 over 41,000 years
- Wobble
- Wobbles like a spinning top every 22,000 years
- Orbit
- Solar Output
- Sunspots show increased solar output
- Thought to increase and decrease over 11 year cycle
- Eruptions
- Place large quantities of ash into atmosphere
- Block out solar radiation
- Cool Earth
- Milankovitch Cycle
- Human
- Enhanced greenhouse gas emissions
- Too much greenhouse gas in atmosphere, warming Earth
- Fossil fuels
- Coal power stations
- Transport
- Destruction of Co2 sinks
- Oceans and plants
- Deforestation
- Increased emissions mean sinks can't keep up
- Enhanced greenhouse gas emissions
- Natural
Impacts
- Melting Ice
- Water stored as ice returns to oceans
- Rising sea level
- Eustatic sea level rise
- Rising sea level
- Water stored as ice returns to oceans
- Oceans get warmer
- Expand - thermal expansion
- Thawing permafrost
- Ground frozen for 2+ years
- Permafrost are natural sinks
- Releases Co2
- Collapse of buildings and pipelines built on it
- Increase in frequency of extreme weather events
- Changes in distributions of climatic regions
- Difficult to predict climate change as too much uncertainty
- Possible Tipping Point
- Catastrophic and irreversible changes
- e.g. ice melt + destruction of natural Co2 sinks
- Catastrophic and irreversible changes
- Melting Ice
Information
- Description
- A Levels Geography Mind Map on Climate Change, created by chrishenry97 on 10/05/2014.
- Created by
- chrishenry97
- Views
- 31
- Rating