
Mind map
Conformance Management & Quality Management
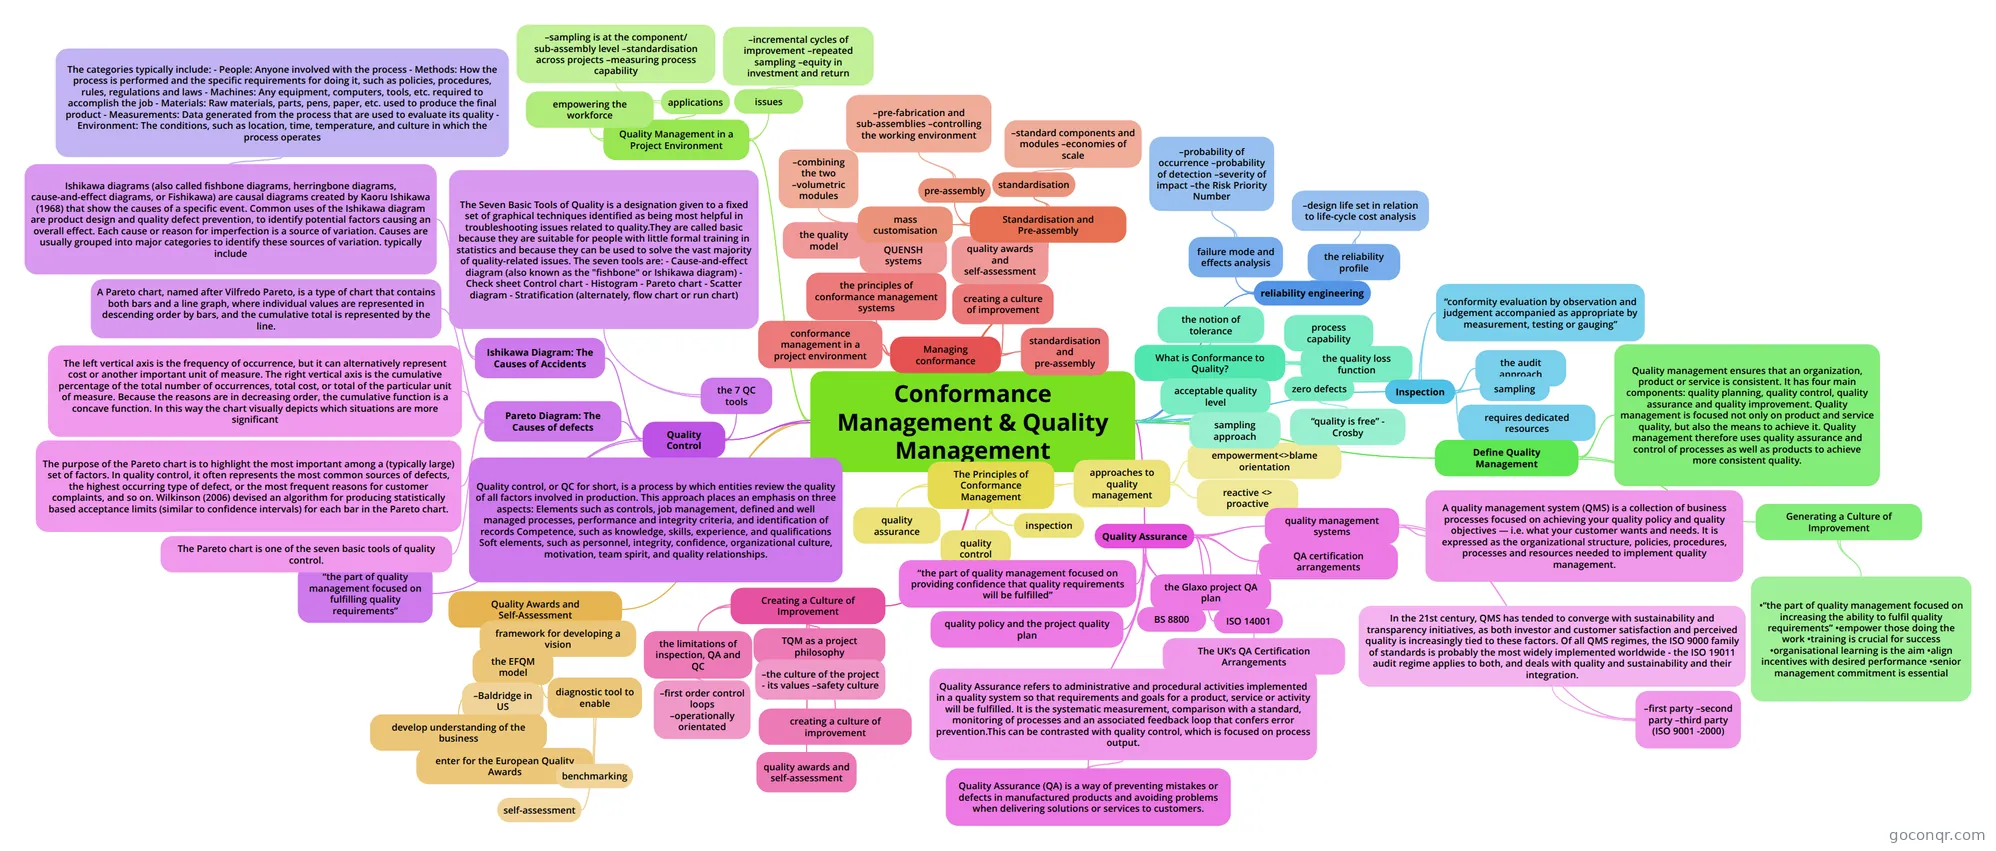
Mind map: Conformance management & quality management
Map content
Conformance Management & Quality Management
Managing conformance
- the principles of conformance management systems
- the quality model
- QUENSH systems
- creating a culture of improvement
- quality awards and self-assessment
- standardisation and pre-assembly
- conformance management in a project environment
- the principles of conformance management systems
The Principles of Conformance Management
- inspection
- quality control
- quality assurance
- approaches to quality management
- empowerment<>blame orientation
- reactive <> proactive
What is Conformance to Quality?
- the notion of tolerance
- acceptable quality level
- sampling approach
- zero defects
- “quality is free” - Crosby
- the quality loss function
- process capability
reliability engineering
- failure mode and effects analysis
- –probability of occurrence –probability of detection –severity of impact –the Risk Priority Number
- the reliability profile
- –design life set in relation to life-cycle cost analysis
- failure mode and effects analysis
Inspection
- “conformity evaluation by observation and judgement accompanied as appropriate by measurement, testing or gauging”
- the audit approach
- sampling
- requires dedicated resources
Quality Control
- “the part of quality management focused on fulfilling quality requirements”
- the 7 QC tools
- The Seven Basic Tools of Quality is a designation given to a fixed set of graphical techniques identified as being most helpful in troubleshooting issues related to quality.They are called basic because they are suitable for people with little formal training in statistics and because they can be used to solve the vast majority of quality-related issues. The seven tools are: - Cause-and-effect diagram (also known as the "fishbone" or Ishikawa diagram) - Check sheet Control chart - Histogram - Pareto chart - Scatter diagram - Stratification (alternately, flow chart or run chart)
- Pareto Diagram: The Causes of defects
- A Pareto chart, named after Vilfredo Pareto, is a type of chart that contains both bars and a line graph, where individual values are represented in descending order by bars, and the cumulative total is represented by the line.
- The left vertical axis is the frequency of occurrence, but it can alternatively represent cost or another important unit of measure. The right vertical axis is the cumulative percentage of the total number of occurrences, total cost, or total of the particular unit of measure. Because the reasons are in decreasing order, the cumulative function is a concave function. In this way the chart visually depicts which situations are more significant
- The purpose of the Pareto chart is to highlight the most important among a (typically large) set of factors. In quality control, it often represents the most common sources of defects, the highest occurring type of defect, or the most frequent reasons for customer complaints, and so on. Wilkinson (2006) devised an algorithm for producing statistically based acceptance limits (similar to confidence intervals) for each bar in the Pareto chart.
- The Pareto chart is one of the seven basic tools of quality control.
- Ishikawa Diagram: The Causes of Accidents
- Ishikawa diagrams (also called fishbone diagrams, herringbone diagrams, cause-and-effect diagrams, or Fishikawa) are causal diagrams created by Kaoru Ishikawa (1968) that show the causes of a specific event. Common uses of the Ishikawa diagram are product design and quality defect prevention, to identify potential factors causing an overall effect. Each cause or reason for imperfection is a source of variation. Causes are usually grouped into major categories to identify these sources of variation. typically include
- The categories typically include: - People: Anyone involved with the process - Methods: How the process is performed and the specific requirements for doing it, such as policies, procedures, rules, regulations and laws - Machines: Any equipment, computers, tools, etc. required to accomplish the job - Materials: Raw materials, parts, pens, paper, etc. used to produce the final product - Measurements: Data generated from the process that are used to evaluate its quality - Environment: The conditions, such as location, time, temperature, and culture in which the process operates
- Ishikawa diagrams (also called fishbone diagrams, herringbone diagrams, cause-and-effect diagrams, or Fishikawa) are causal diagrams created by Kaoru Ishikawa (1968) that show the causes of a specific event. Common uses of the Ishikawa diagram are product design and quality defect prevention, to identify potential factors causing an overall effect. Each cause or reason for imperfection is a source of variation. Causes are usually grouped into major categories to identify these sources of variation. typically include
- Quality control, or QC for short, is a process by which entities review the quality of all factors involved in production. This approach places an emphasis on three aspects: Elements such as controls, job management, defined and well managed processes, performance and integrity criteria, and identification of records Competence, such as knowledge, skills, experience, and qualifications Soft elements, such as personnel, integrity, confidence, organizational culture, motivation, team spirit, and quality relationships.
Quality Assurance
- “the part of quality management focused on providing confidence that quality requirements will be fulfilled”
- quality management systems
- –first party –second party –third party (ISO 9001 -2000)
- In the 21st century, QMS has tended to converge with sustainability and transparency initiatives, as both investor and customer satisfaction and perceived quality is increasingly tied to these factors. Of all QMS regimes, the ISO 9000 family of standards is probably the most widely implemented worldwide - the ISO 19011 audit regime applies to both, and deals with quality and sustainability and their integration.
- A quality management system (QMS) is a collection of business processes focused on achieving your quality policy and quality objectives — i.e. what your customer wants and needs. It is expressed as the organizational structure, policies, procedures, processes and resources needed to implement quality management.
- –first party –second party –third party (ISO 9001 -2000)
- quality policy and the project quality plan
- QA certification arrangements
- The UK’s QA Certification Arrangements
- the Glaxo project QA plan
- BS 8800
- ISO 14001
- Quality Assurance (QA) is a way of preventing mistakes or defects in manufactured products and avoiding problems when delivering solutions or services to customers.
- Quality Assurance refers to administrative and procedural activities implemented in a quality system so that requirements and goals for a product, service or activity will be fulfilled. It is the systematic measurement, comparison with a standard, monitoring of processes and an associated feedback loop that confers error prevention.This can be contrasted with quality control, which is focused on process output.
Creating a Culture of Improvement
- the limitations of inspection, QA and QC
- –first order control loops –operationally orientated
- TQM as a project philosophy
- –the culture of the project - its values –safety culture
- creating a culture of improvement
- quality awards and self-assessment
- the limitations of inspection, QA and QC
Quality Awards and Self-Assessment
- the EFQM model
- –Baldridge in US
- framework for developing a vision
- develop understanding of the business
- enter for the European Quality Awards
- diagnostic tool to enable
- benchmarking
- self-assessment
- the EFQM model
Standardisation and Pre-assembly
- standardisation
- –standard components and modules –economies of scale
- pre-assembly
- –pre-fabrication and sub-assemblies –controlling the working environment
- mass customisation
- –combining the two –volumetric modules
- standardisation
Quality Management in a Project Environment
- issues
- –incremental cycles of improvement –repeated sampling –equity in investment and return
- applications
- –sampling is at the component/ sub-assembly level –standardisation across projects –measuring process capability
- empowering the workforce
- issues
Define Quality Management
- Generating a Culture of Improvement
- •“the part of quality management focused on increasing the ability to fulfil quality requirements” •empower those doing the work •training is crucial for success •organisational learning is the aim •align incentives with desired performance •senior management commitment is essential
- Quality management ensures that an organization, product or service is consistent. It has four main components: quality planning, quality control, quality assurance and quality improvement. Quality management is focused not only on product and service quality, but also the means to achieve it. Quality management therefore uses quality assurance and control of processes as well as products to achieve more consistent quality.
- Generating a Culture of Improvement
Information
- Description
- Mind Map on Conformance Management & Quality Management, created by juliajchesher on 19/05/2014.
- Created by
- juliajchesher
- Views
- 39
- Rating
More on Quality Assurance and Quality Control