
Mind map
Unit two
Map content
Unit two
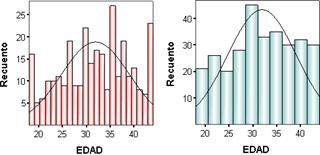
Histograms
- To determine the spread or variation of a set of data points
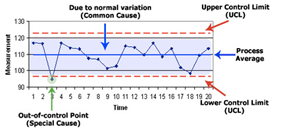
Control Charts
- One of the goal on using a control chad is to achieve and maintain process stability
- Why use?
- To monitor process variation
- Common causes
- This variation is expected and predictable
- Why use?
- One of the goal on using a control chad is to achieve and maintain process stability
"P" Charts
- Are used to measure the proportion of items in a sample that are defectives
- Ucl=p+Zσp
- Lcl=p-Zσp
- P
- Sample of proportion defective
- P
- Z
- Number of standard deviations
- σp
- Standar deviation of sample
- σp=√((P(1-p))/n)
- Lcl=p-Zσp
- Ucl=p+Zσp
- Are used to measure the proportion of items in a sample that are defectives
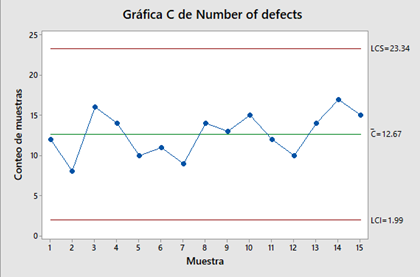
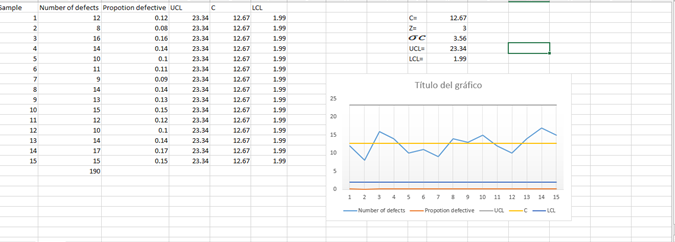
"C" charts
- Are used to monitor the quantity of defects per united
- UCL
- C +Zσc
- LCL
- C-Zσc
- σc
- √c
- UCL
- Are used to monitor the quantity of defects per united
Variable data charts
- Elapsed time
- Temperature
- Radiation dose
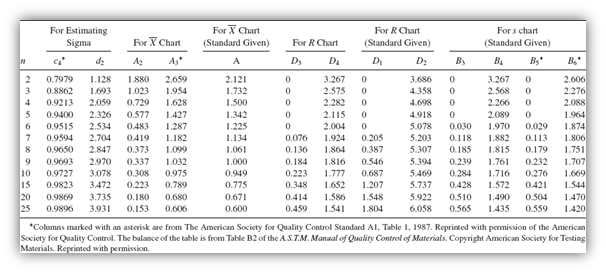
“X” BAR AND “R” CHARTS
- x
- Media
- UCL=D4 R
- LCL=D3*R
- UCL=D4 R
- Media
- R
- Rango
- UCL=X+A2 R
- LCL=X-A2*R
- UCL=X+A2 R
- Rango
- x
THE 7 QC STATISTICAL TOOLS
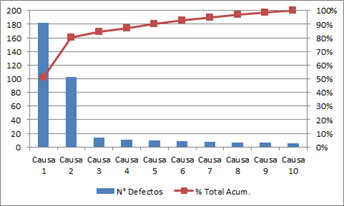
- Pareto charts
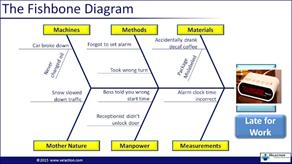
- Cause and effect diagram
- Graphs
- Check sheet
- Histograms
- Scatter diagrams
- Control charts
Fihbone
- components
- Straight line
- Ribs
- Medium size bones
- Small bone
- components
Images and files in the map
Information
- Description
- negocios internacionales Mind Map on Unit two, created by Alejandra Muñoz on 26/06/2017.
- Created by
- Alejandra Muñoz
- Views
- 0
- History
-
- Created by Alejandra Muñoz · Jun 22, 2017
- Copied by Alejandra Muñoz · Jun 26, 2017
- Rating