Mind map
Data Spider diagram
Map content
Data Spider diagram
Binary
- Unsigned Integers
- Numbers that aren't negative
- Sign magnitude
- Two's compliment
- Swap them, add 1.
- Binary Arithmetic
- Arithmetic shift. Move to the left it doubles, to the right it halves.
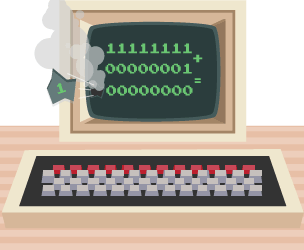
- Overflow is where it shifts to the left and data is lost and it can miscalculate
- Unsigned Integers
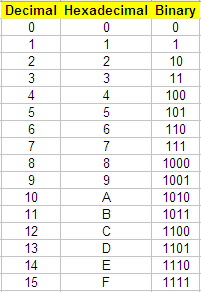
Hex (Not designed for computers, used for people to read big numbers easily)
- Conversion
- Goes from 0 to F because each digit of Hex is representing 1 nibble.
Characters (Any single character) Data on some programme languages, not Python.
- ASCII
- Unicode (Character sets)
Images (Made up of Pixels)
- Bit Depth (Colour Depth)
- Resolution (A x B)
- Calculating File Size
- (Res A x Res B x Bit Depth) / 8(Bytes) x 1024(KB)
Sound (Analogue)
- Sampling frequency
- Resolution
- Bits per sample or bit depth
- Frequency x Bit Depth x Channels x Length = File Size
Data Units
- Data capacity, Bit, Nibble, Byte, Kilobyte, Megabyte, Gigabyte, Terabyte
Compression
- Lossy
- Lossy compression is when you compress a file but lose detail
- Lossless is the same as lossy but you don't lose quality
- Lossy