
Mind map
Quantitative Analysis
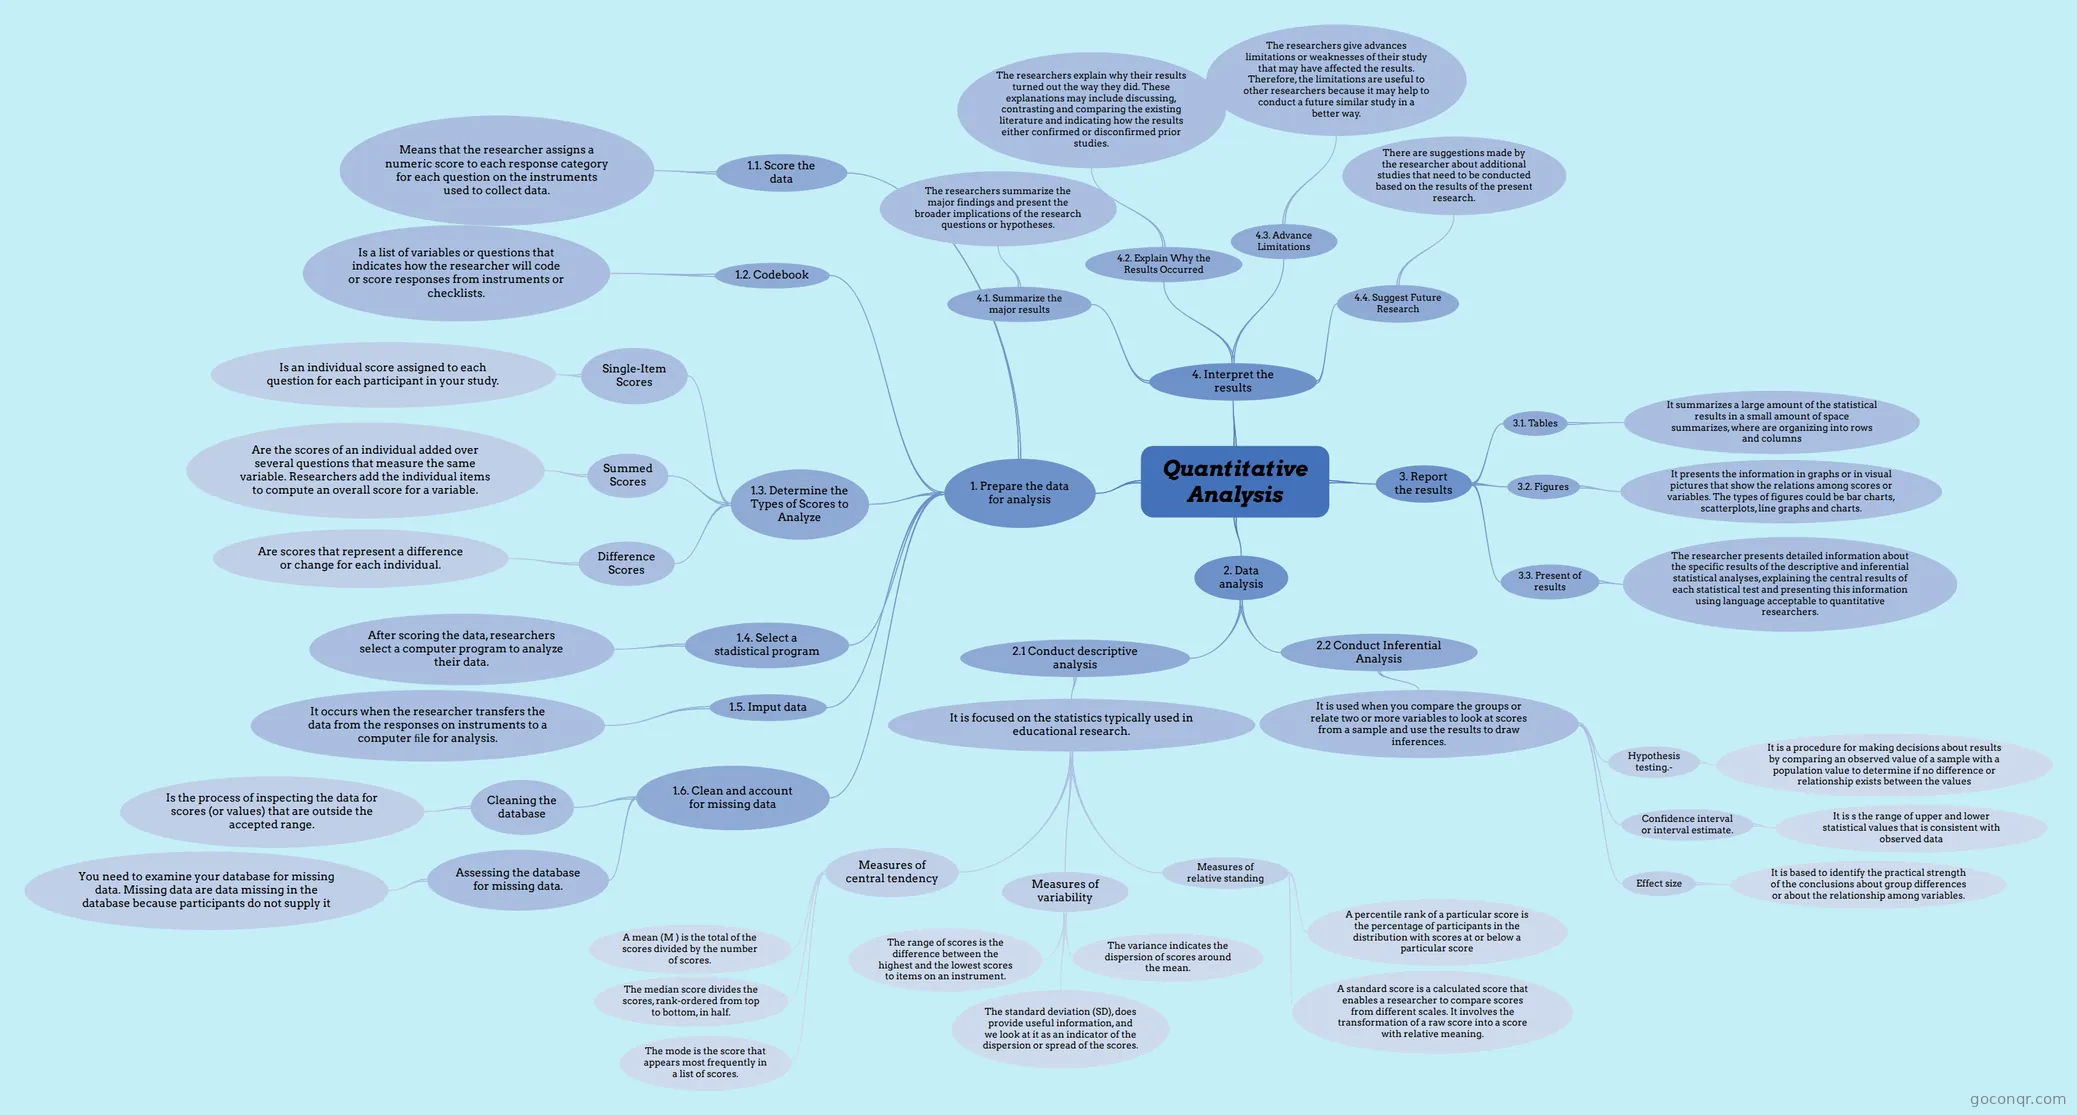
Mind map: quantitative analysis
Map content
Quantitative Analysis
1. Prepare the data for analysis
- 1.1. Score the data
- Means that the researcher assigns a numeric score to each response category for each question on the instruments used to collect data.
- 1.2. Codebook
- Is a list of variables or questions that indicates how the researcher will code or score responses from instruments or checklists.
- 1.3. Determine the Types of Scores to Analyze
- Single-Item Scores
- Is an individual score assigned to each question for each participant in your study.
- Summed Scores
- Are the scores of an individual added over several questions that measure the same variable. Researchers add the individual items to compute an overall score for a variable.
- Difference Scores
- Are scores that represent a difference or change for each individual.
- Single-Item Scores
- 1.4. Select a stadistical program
- After scoring the data, researchers select a computer program to analyze their data.
- 1.5. Imput data
- It occurs when the researcher transfers the data from the responses on instruments to a computer file for analysis.
- 1.6. Clean and account for missing data
- Cleaning the database
- Is the process of inspecting the data for scores (or values) that are outside the accepted range.
- Assessing the database for missing data.
- You need to examine your database for missing data. Missing data are data missing in the database because participants do not supply it
- Cleaning the database
- 1.1. Score the data
2. Data analysis
- 2.1 Conduct descriptive analysis
- It is focused on the statistics typically used in educational research.
- Measures of central tendency
- A mean (M ) is the total of the scores divided by the number of scores.
- The median score divides the scores, rank-ordered from top to bottom, in half.
- The mode is the score that appears most frequently in a list of scores.
- Measures of variability
- The range of scores is the difference between the highest and the lowest scores to items on an instrument.
- The variance indicates the dispersion of scores around the mean.
- The standard deviation (SD), does provide useful information, and we look at it as an indicator of the dispersion or spread of the scores.
- Measures of relative standing
- A percentile rank of a particular score is the percentage of participants in the distribution with scores at or below a particular score
- A standard score is a calculated score that enables a researcher to compare scores from different scales. It involves the transformation of a raw score into a score with relative meaning.
- Measures of central tendency
- It is focused on the statistics typically used in educational research.
- 2.2 Conduct Inferential Analysis
- It is used when you compare the groups or relate two or more variables to look at scores from a sample and use the results to draw inferences.
- Hypothesis testing.-
- It is a procedure for making decisions about results by comparing an observed value of a sample with a population value to determine if no difference or relationship exists between the values
- Confidence interval or interval estimate.
- It is s the range of upper and lower statistical values that is consistent with observed data
- Effect size
- It is based to identify the practical strength of the conclusions about group differences or about the relationship among variables.
- Hypothesis testing.-
- It is used when you compare the groups or relate two or more variables to look at scores from a sample and use the results to draw inferences.
- 2.1 Conduct descriptive analysis
3. Report the results
- 3.1. Tables
- It summarizes a large amount of the statistical results in a small amount of space summarizes, where are organizing into rows and columns
- 3.2. Figures
- It presents the information in graphs or in visual pictures that show the relations among scores or variables. The types of figures could be bar charts, scatterplots, line graphs and charts.
- 3.3. Present of results
- The researcher presents detailed information about the specific results of the descriptive and inferential statistical analyses, explaining the central results of each statistical test and presenting this information using language acceptable to quantitative researchers.
- 3.1. Tables
4. Interpret the results
- 4.1. Summarize the major results
- The researchers summarize the major findings and present the broader implications of the research questions or hypotheses.
- 4.2. Explain Why the Results Occurred
- The researchers explain why their results turned out the way they did. These explanations may include discussing, contrasting and comparing the existing literature and indicating how the results either confirmed or disconfirmed prior studies.
- 4.3. Advance Limitations
- The researchers give advances limitations or weaknesses of their study that may have affected the results. Therefore, the limitations are useful to other researchers because it may help to conduct a future similar study in a better way.
- 4.4. Suggest Future Research
- There are suggestions made by the researcher about additional studies that need to be conducted based on the results of the present research.
- 4.1. Summarize the major results
Information
- Description
- Relizado por: Karal Vélez Quiñónez y Josselyn Jiménez Jiménez Referencias: Creswell, J. W. (2002). Educational research: Planning, conducting, and evaluating quantitative (pp. 146-166). Upper Saddle River, NJ: Prentice Hall.
- Created by
- Josselyn Jimenez
- Views
- 12
- Rating