
Mind map
box plots and grouped frequency tables
Map content
box plots and grouped frequency tables
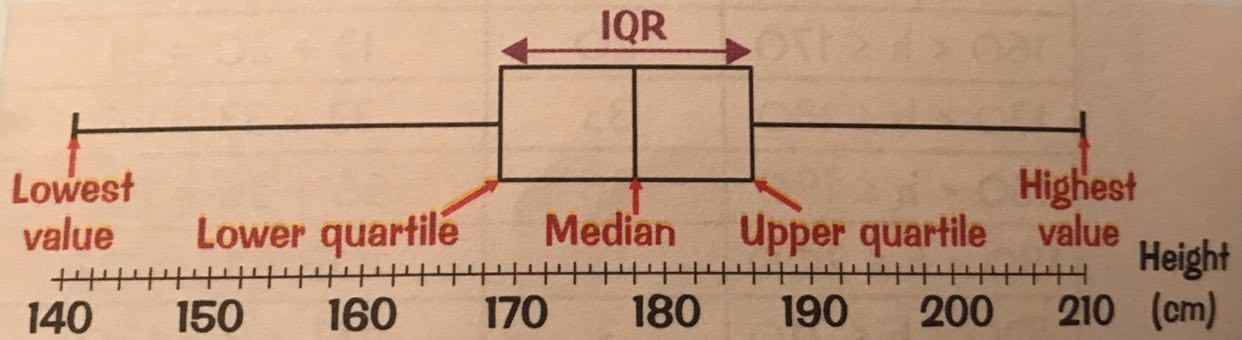
the interquartile range is the difference between the upper quartile and the lower quartile
on a box plot the left mark shows the lowest value, the right mark shows the highest value and the box shows the interquartile range with the median as the line in the middle
a grouped frequency table groups the data into classes. There are no gaps between classes
- to find the mid-interval values, add together the two values in the class and divide it by 2
to find the mean, add a third column of mid interval value and then add a fourth column of frequency times mid interval value for each class. The mean is the fourth column (frequency x mid interval value) total ÷ by the frequency total
the modal class is the one with the highest frequency
to find the class containing the median add 1 to the total frequency and then divide by 2, whatever class this number is in, is the class with the median
Images and files in the map
Information
- Description
- GCSE Maths (probability and statistics) Mind Map on box plots and grouped frequency tables, created by lizabeth rawson on 27/02/2020.
- Created by
- lizabeth rawson
- Views
- 6
- Rating