
Mind map
Bivariate measures
Map content
Bivariate measures
The nature (nominal, ordinal or numerical) of the characteristics under study will determine the most appropriate tools for their analysis.
Bivariate statistical techniques allow the joint analysis of two characteristics of individuals in a population with the purpose of detecting possible relationships between them.
Dispersion diagram
- The scatter diagram is a mathematical graph that uses Cartesian coordinates to show two variables, this graph allows to analyze if there is
- Este diagrama, es una herramienta que ayuda a establecer la posible relación entre dos variables, de forma gráfica haciendo más fácil la visualización e interpretación de los datos.
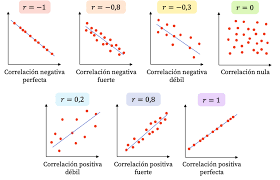
- It can happen that two variables are related to the extent that if the value of one increases, the other will also increase, in this case there would be a positive correlation.
- While one increases the other decreases, there will be a negative correlation.
- The scatter diagram is a mathematical graph that uses Cartesian coordinates to show two variables, this graph allows to analyze if there is
Correlation Analysis
- The purpose of correlation is to examine the direction and strength of the association between two quantitative variables.
- In this way we will know the intensity of the relationship between them and if, by increasing the value of one variable, the value of the other variable increases or decreases.
- The purpose of correlation is to examine the direction and strength of the association between two quantitative variables.
Correlation coefficient
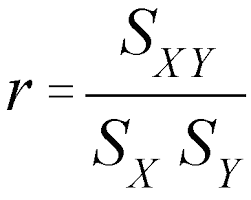
- The most widely used sample estimator to evaluate the linear association between two variables X and Y is the Pearson correlation coefficient (r).
- It is an index that measures if the points have a tendency to be arranged in a straight line. It can take values between -1 and +1
- Se define como la covarianza muestral entre X e Y dividida por el producto de las desviaciones típicas de cada variante.
Coefficient of Linear Determination
- The result of the determination coefficient ranges between 0 and 1
- The closer its value is located to one, the greater the fit of the model to the variable that we are trying to explain.
- The closer it is to zero, the less fitted the model will be, and therefore the less reliable it will be.
- It is defined as the proportion of the total variance of the variable explained by the regression. The coefficient of determination, also called R square, reflects the goodness of the fit of a model to the variable that it intends to explain.
- The result of the determination coefficient ranges between 0 and 1
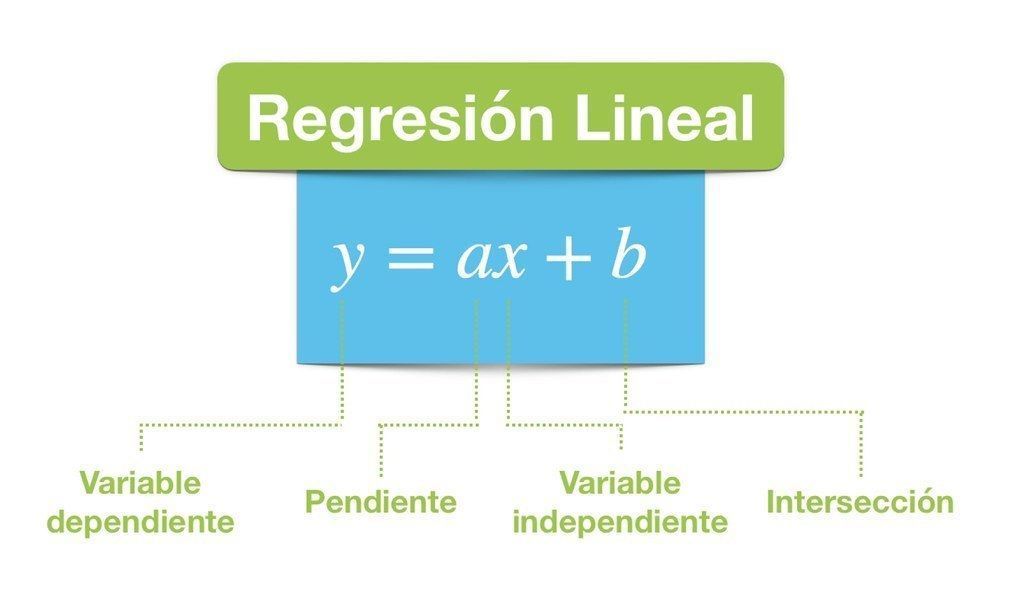
linear regression
- It allows determining the degree of dependence of the series of values X and Y, predicting the value and estimating that it would be obtained for a value x that is not in the distribution.
- Simple Linear Regression
- two variables
- Multiple Linear Regression
- More than two variables
- Simple Linear Regression
- It allows determining the degree of dependence of the series of values X and Y, predicting the value and estimating that it would be obtained for a value x that is not in the distribution.
Images and files in the map



Information
- Description
- Mind Map on Bivariate measures, created by KARETH ALEJANDRA CORREA MARTÍNEZ on 01/12/2022.
- Created by
- KARETH ALEJANDRA CORREA MARTÍNEZ
- Views
- 0
- Rating