
Mind map
Population Growth
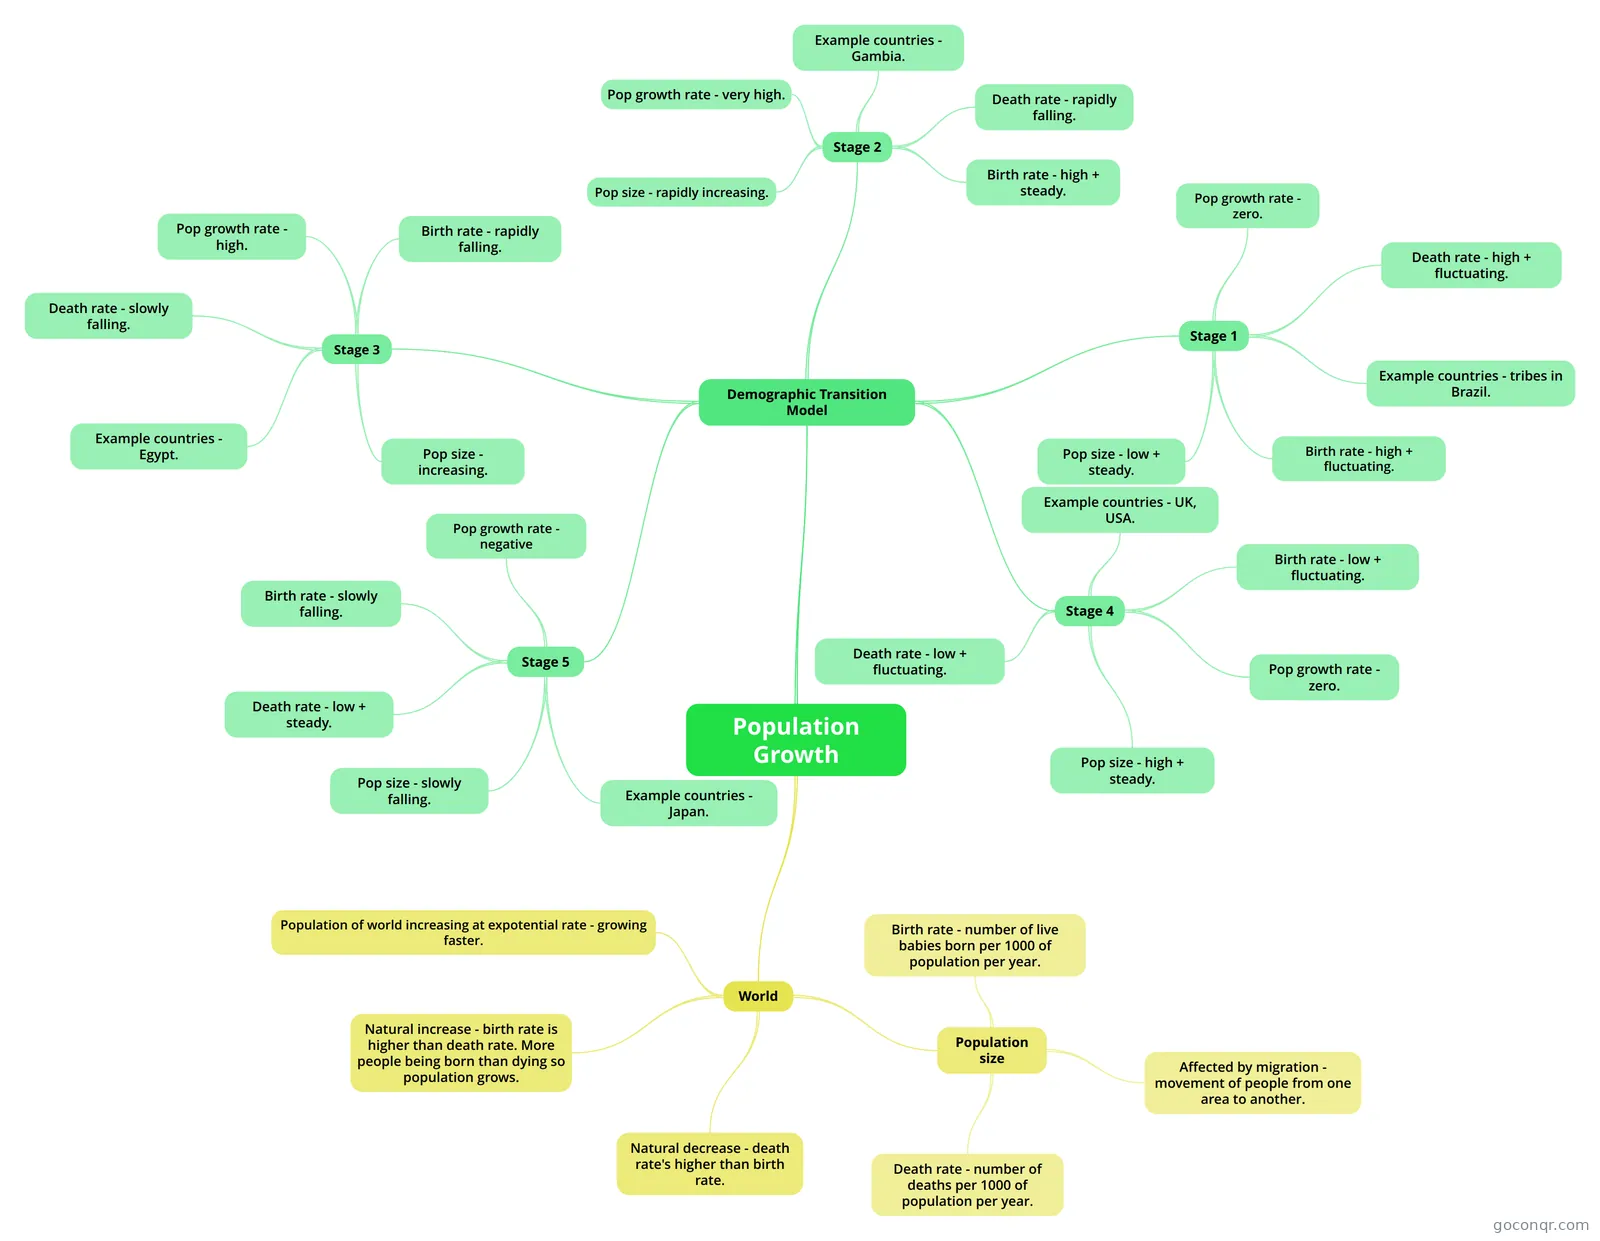
Mind map: Population growth
Map content
Population Growth
World
- Population of world increasing at expotential rate - growing faster.
- Population size
- Birth rate - number of live babies born per 1000 of population per year.
- Death rate - number of deaths per 1000 of population per year.
- Affected by migration - movement of people from one area to another.
- Natural increase - birth rate is higher than death rate. More people being born than dying so population grows.
- Natural decrease - death rate's higher than birth rate.
Demographic Transition Model
- Stage 1
- Birth rate - high + fluctuating.
- Death rate - high + fluctuating.
- Pop growth rate - zero.
- Pop size - low + steady.
- Example countries - tribes in Brazil.
- Stage 2
- Birth rate - high + steady.
- Death rate - rapidly falling.
- Pop growth rate - very high.
- Pop size - rapidly increasing.
- Example countries - Gambia.
- Stage 3
- Birth rate - rapidly falling.
- Death rate - slowly falling.
- Pop growth rate - high.
- Pop size - increasing.
- Example countries - Egypt.
- Stage 4
- Birth rate - low + fluctuating.
- Death rate - low + fluctuating.
- Pop growth rate - zero.
- Pop size - high + steady.
- Example countries - UK, USA.
- Stage 5
- Birth rate - slowly falling.
- Death rate - low + steady.
- Pop growth rate - negative
- Pop size - slowly falling.
- Example countries - Japan.
- Stage 1
Information
- Description
- Mind Map on Population Growth, created by anndjan21 on 30/11/2013.
- Created by
- anndjan21
- Views
- 503
- Tags
- Rating