
Mind map
The Demographic Transition Model
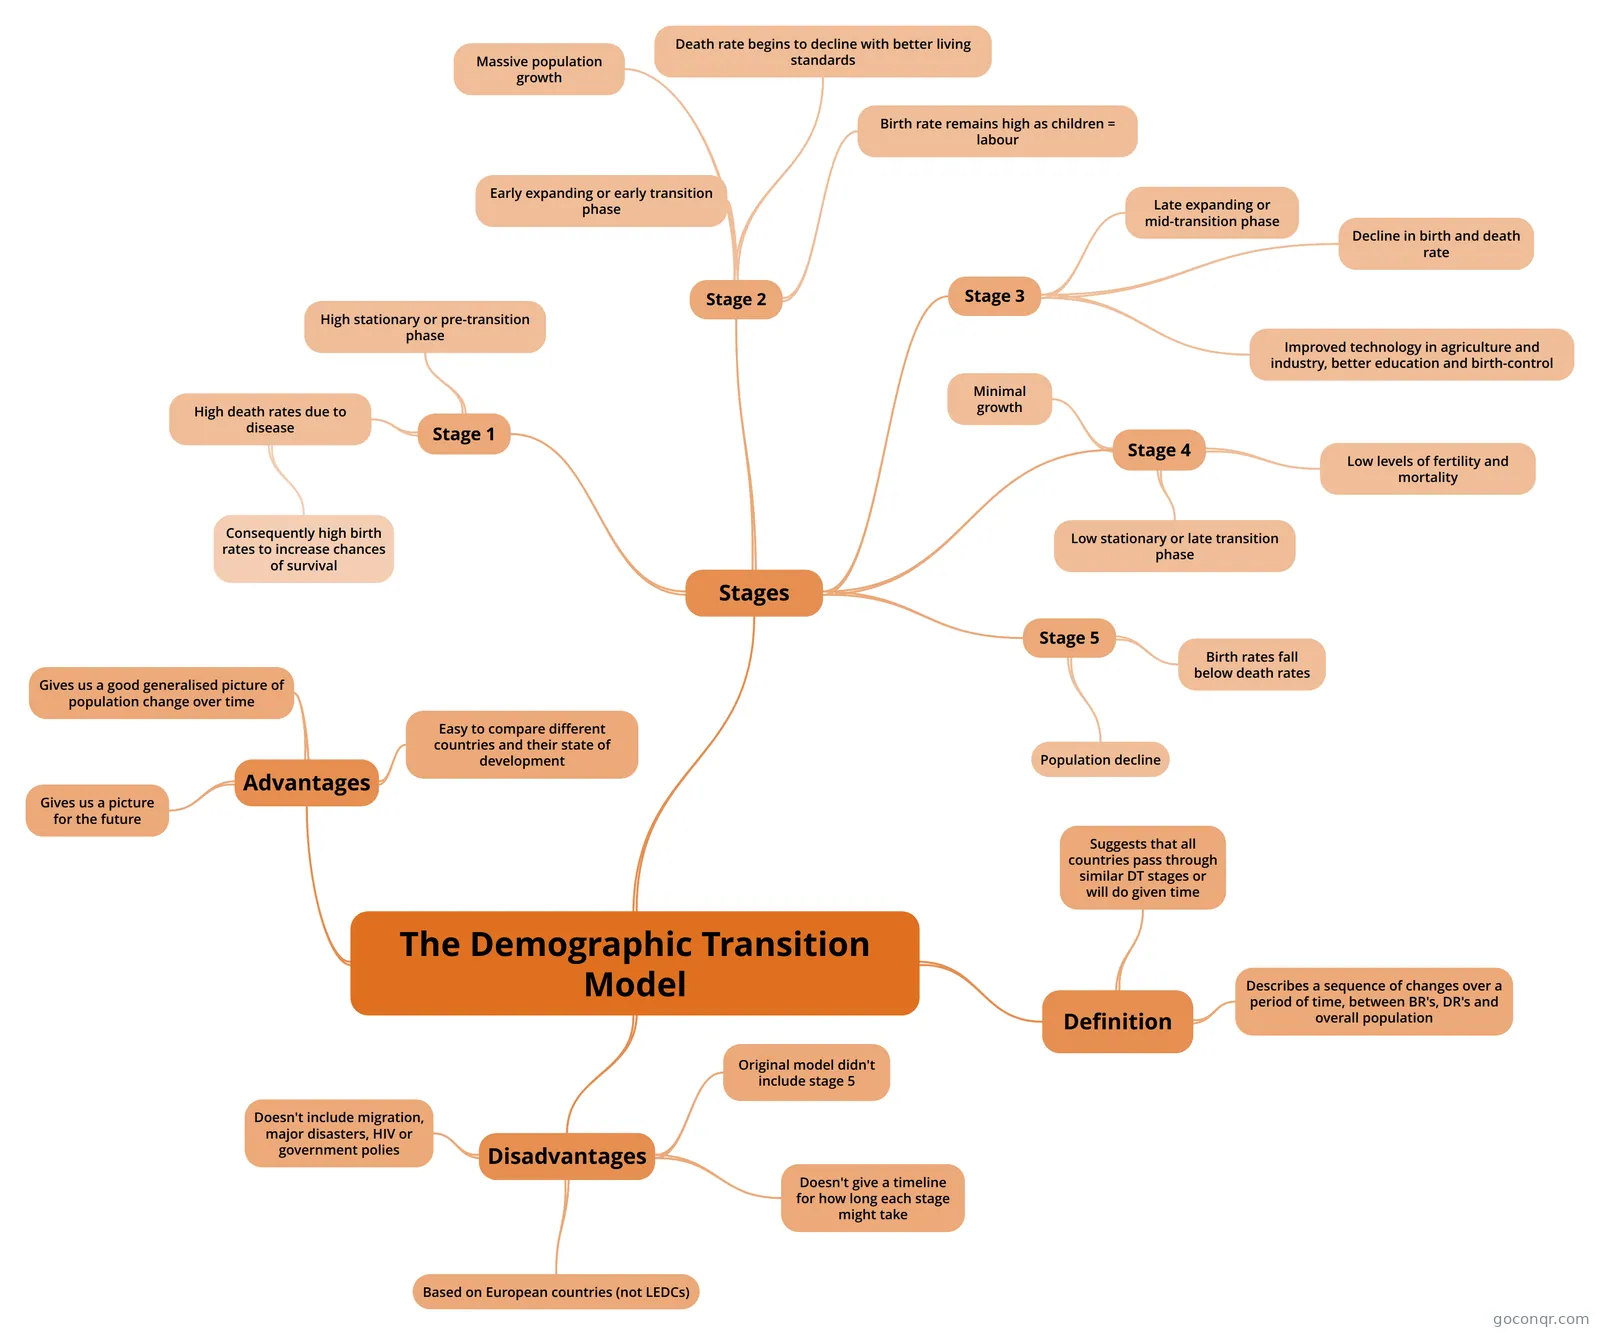
Mind map: The Demographic Transition Model
Map content
The Demographic Transition Model
Definition
- Suggests that all countries pass through similar DT stages or will do given time
- Describes a sequence of changes over a period of time, between BR's, DR's and overall population
Advantages
- Gives us a good generalised picture of population change over time
- Gives us a picture for the future
- Easy to compare different countries and their state of development
Disadvantages
- Based on European countries (not LEDCs)
- Original model didn't include stage 5
- Doesn't include migration, major disasters, HIV or government polies
- Doesn't give a timeline for how long each stage might take
Stages
- Stage 1
- High stationary or pre-transition phase
- High death rates due to disease
- Consequently high birth rates to increase chances of survival
- Stage 2
- Early expanding or early transition phase
- Death rate begins to decline with better living standards
- Birth rate remains high as children = labour
- Massive population growth
- Stage 3
- Late expanding or mid-transition phase
- Improved technology in agriculture and industry, better education and birth-control
- Decline in birth and death rate
- Stage 4
- Low stationary or late transition phase
- Low levels of fertility and mortality
- Minimal growth
- Stage 5
- Birth rates fall below death rates
- Population decline
- Stage 1
Information
- Description
- Geography (Population) Mind Map on The Demographic Transition Model, created by maddiemurchie23 on 21/04/2013.
- Created by
- maddiemurchie23
- Views
- 338
- Tags
- Rating