
Mind map
Probability
Map content
Probability
Axions
- P(a) = 1
- P(a) should be between 0 and 1
- (In disjoin sets) P(a or b) = P(a) + P(b)
- Prove [ P(AUB) =P(A)+P(B)-P(AB) ]
- The union of two events, A U B, can be broken up into three sets:
- A that are not in B (AB´)
- B that are not in A (A´B)
- Both A and B (AB)
- Together, these three sets contain every element of AUB.
- P(AUB) = P(AB´ U A´B U AB ).
- The three sets on the right are disjoint, thereforeew it may aply the addition
- P(AUB) = P(AB´) + P(A´ B) + P(AB).
- Also P(A)
- P(A) = P(AB´U AB) = P(AB´) + P(AB),
- Also P(B)
- P(B) = P(A´B U AB) = P(A´B) + P(AB),
- A´B and AB are disjoint. Adding, we find
- P(A) + P(B) = P(AB´+ P(A´B) +2×P(AB).
- This would be P(AUB), but for the fact that P(AB) is counted twice, not once. It follows that, in general,
- P(AUB) = P(A) + P(B) - P(AB).
- The union of two events, A U B, can be broken up into three sets:
Experiment
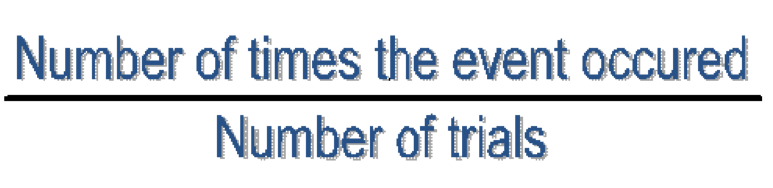
- The ratio of the times an event occurs over the trials
Sample space
- The sample space of an experiment is the set of all possible outcomes of that experiment.
- Example
- What is the probability of each outcome when a dime is tossed?
- The outcomes of this experiment are head and tail.
- Probabilities:
- P(tail) = 1/2
- P(head) = 1/2
- Sample space:
- Head
- Tail
- Probabilities:
- The outcomes of this experiment are head and tail.
- What is the probability of each outcome when a dime is tossed?
Event
- Set of outcomes of an experiment
- Example
- A deck of 52 playing cards
- Red/ black at the same without being a joker
- Probability= 0
- Event= {}
- The 5 of Hearts
- Probability = 1
- Event = {5-hearts}
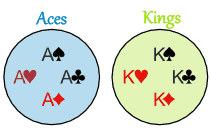
- A King
- Probability = 4
- Event= {K♥, K♠, K ♦, K♣ }
- Red/ black at the same without being a joker
- A deck of 52 playing cards
- Mutually exclusive
- Cant happen at the same time
- Are dependent
- Because one situation may happen without the other
- independent events
- Two events, A and B, are independent if the fact that A occurs does not affect the probability of B occurring.
- Multiplication rule
- P(A and B) = P(A) · P(B)
- Conditional probability
- When two events, A and B, are dependent, the probability of both occurring is
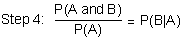
- The Conditional Probability of an event can be derived from Multiplication Rule:
- Multiplication rule
- Divide both sides
- Cancel P(a)
- Commute the equation
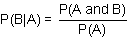
- Formula
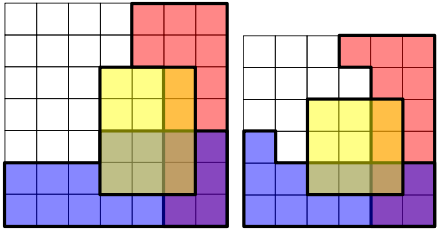
- These are two examples illustrating conditional independence
- Each cell represents a possible outcome.
- The events R, B and Y are represented by the areas shaded red, blue and yellow respectively. The overlap between the events R and B is shaded purple.
- R and B are conditionally independent given Y because:
- but not conditionally independent given not Y because: :
- R and B are conditionally independent given Y because:
- The events R, B and Y are represented by the areas shaded red, blue and yellow respectively. The overlap between the events R and B is shaded purple.
- Each cell represents a possible outcome.
- Complementary event
- P(A´ ) = 1 − P(A).
- Proof
- They are
- A ∪ A´ = S
- A ∩ A´ = ∅
- Therefore, by Axiom theory
- P(A ∪ A´ ) = P(A) + P(A´ ) = 1
- Since P(A ∪ A´) = P(S) = 1, whence P(A´) = 1 − P(A).
- They are
- Proof
- P(A´ ) = 1 − P(A).
- Can´t extend to 1
- Because the maximum will be the s/s which will be 1 and if it increases it would have a decimal which is imposible
Law of total
- Is a fundamental rule relating marginal probabilities to conditional probabilities
Bayes theorem
- Describes the probability of an event, based on prior knowledge of conditions that might be related to the event.
- Example
- Cancer of 65
- Cancer = General prevalence of cancer
- 1%
- Writing C for the event "having cancer"
- P(C)=0.01
- Suppose also that the probability of being 65 years old is 0.2%
- P(65)=0.002
- Knowing this, we can calculate the probability of having cancer as a 65-year-old by applying Bayes' formula:
- Cancer = General prevalence of cancer
- Cancer of 65
Example
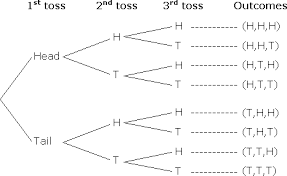
- Sample space when 1,2 and 3 coins are thrown
- {HHH, HHT, HTH, HTT, THH, THT, TTH, TTT}
- Sample space when 2; 6 sided dice
- {1-1, 1-2, 1-3, 1-4, 1-5, 1-6, 2-1, 2-2, 2-3, 2-4, 2-5, 2-6, 3-1, 3-2, 3-3, 3-4, 3-5, 3-6, 4-1, 4-2, 4-3, 4-4, 4-5, 4-6, 5-1, 5-2, 5-3, 5-4, 5-5, 5-6, 6-1, 6-2, 6-3, 6-4, 6-5, 6-6}
- Sample space when 1,2 and 3 coins are thrown
Fundamental counting principle
- When there are m ways to do one thing, and n ways to do another, then there are m×n ways of doing both.
- Example
- You have 3 shirts and 4 pants.
- That means 3×4=12 different outfits.
Throwing dice
- When throwing the amount of dices needed its the same as telling to throw one time the amount of dices, it will have the same probability.
Probability distribution
- A function of a discrete variable whose integral over any interval is the probability that the variate specified by it will lie within that interval.
Random variable
- Usually written X, is a variable whose possible values are numerical outcomes of a random phenomenon. There are two types of random variables, discrete and continuous.
Binomial diastribution
- The binomial distribution function specifies the number of times (x) that an event occurs in independent trials .
- Conditions
- The number of observations n is fixed.
- Each observation is independent.
- Each observation represents one of two outcomes ("success" or "failure")
- The probability of "success" p is the same for each outcome.
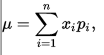
- Mean
- is a binomially distributed random variable, n being the total number of experiments and p the probability of each experiment yielding a successful result, then the expected value of X is:[3]
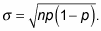
- Standart deriviatiuon
Normal distribution
- A normal distribution in a variate with mean and variance is a statistic distribution with probability density function.
- Areas under normal distribution
- Areas under portions of a normal distribution can be computed by using calculus. Since this is a non-mathematical treatment of statistics, we will rely on computer programs and tables to determine these areas.
Z- score
- z = (x – μ) / σ
Standard normal distribution
- As discussed in the introductory section, normal distributions do not necessarily have the same means and standard deviations.
- mu = 0 and sigma =1
- mu and sigma are other than 0 and 1
- Sigma level
- As discussed in the introductory section, normal distributions do not necessarily have the same means and standard deviations.
Images and files in the map








Information
- Description
- Mind Map on Probability, created by Maria jose Cuellar on 24/01/2017.
- Created by
- Maria jose Cuellar · Jan 2017
- Updated
- Jan 25, 2017
- Views
- 0
- Rating