
Mind map
Absorption and Emission Spectra
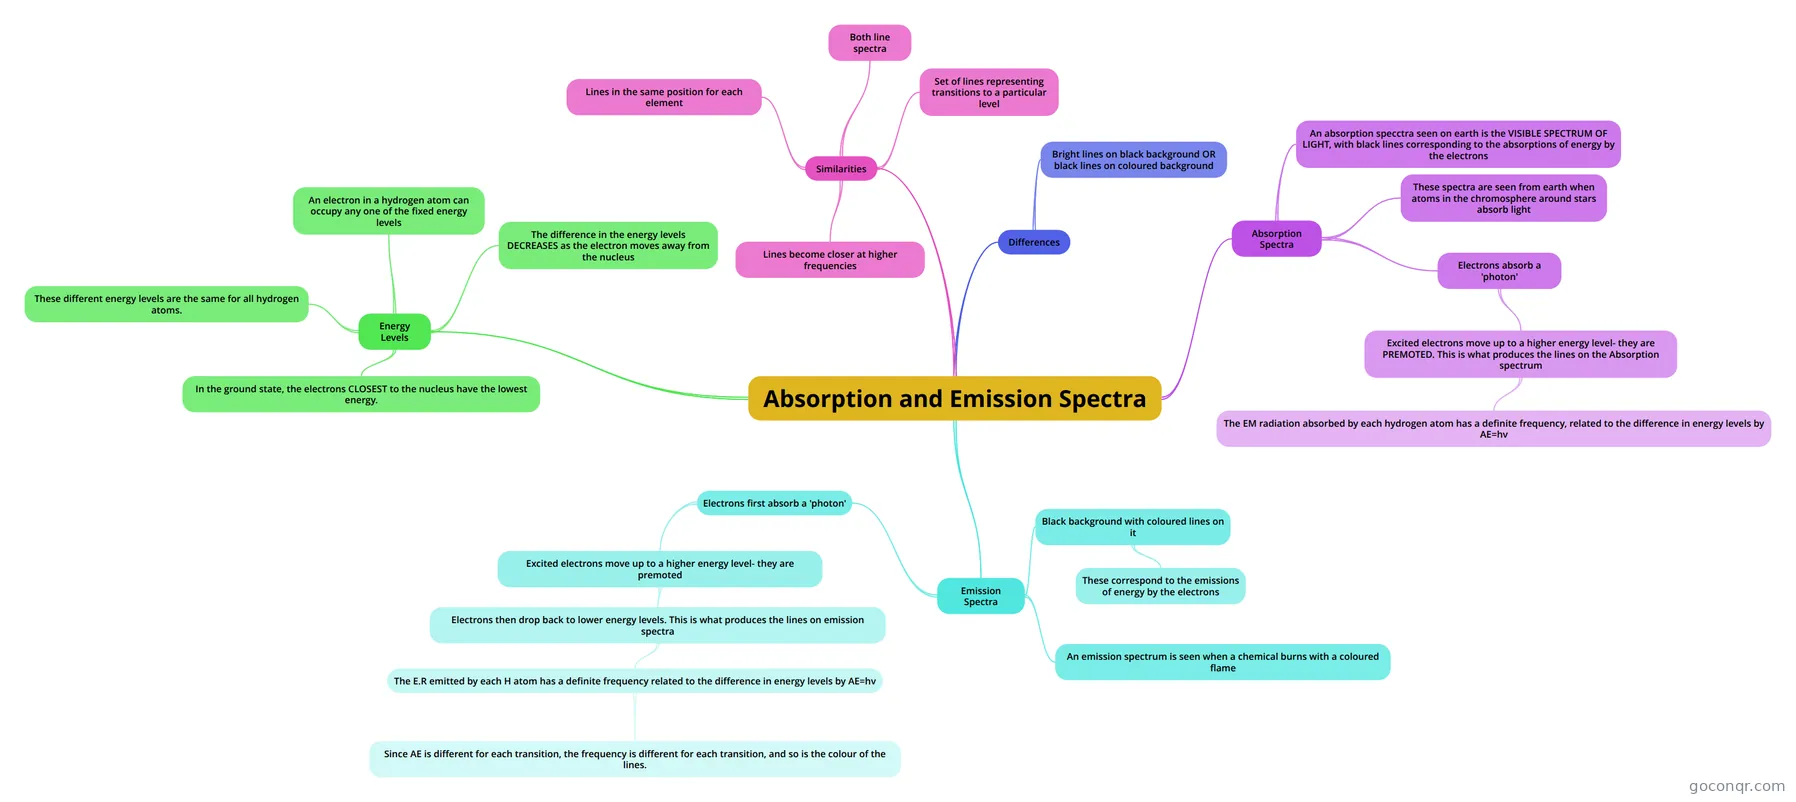
Mind map: Absorption and emission spectra
Map content
Absorption and Emission Spectra
Energy Levels
- An electron in a hydrogen atom can occupy any one of the fixed energy levels
- These different energy levels are the same for all hydrogen atoms.
- In the ground state, the electrons CLOSEST to the nucleus have the lowest energy.
- The difference in the energy levels DECREASES as the electron moves away from the nucleus
Absorption Spectra
- An absorption specctra seen on earth is the VISIBLE SPECTRUM OF LIGHT, with black lines corresponding to the absorptions of energy by the electrons
- These spectra are seen from earth when atoms in the chromosphere around stars absorb light
- Electrons absorb a 'photon'
- Excited electrons move up to a higher energy level- they are PREMOTED. This is what produces the lines on the Absorption spectrum
- The EM radiation absorbed by each hydrogen atom has a definite frequency, related to the difference in energy levels by AE=hv
- Excited electrons move up to a higher energy level- they are PREMOTED. This is what produces the lines on the Absorption spectrum
Emission Spectra
- Black background with coloured lines on it
- These correspond to the emissions of energy by the electrons
- An emission spectrum is seen when a chemical burns with a coloured flame
- Electrons first absorb a 'photon'
- Excited electrons move up to a higher energy level- they are premoted
- Electrons then drop back to lower energy levels. This is what produces the lines on emission spectra
- The E.R emitted by each H atom has a definite frequency related to the difference in energy levels by AE=hv
- Since AE is different for each transition, the frequency is different for each transition, and so is the colour of the lines.
- The E.R emitted by each H atom has a definite frequency related to the difference in energy levels by AE=hv
- Electrons then drop back to lower energy levels. This is what produces the lines on emission spectra
- Excited electrons move up to a higher energy level- they are premoted
- Black background with coloured lines on it
Similarities
- Both line spectra
- Lines in the same position for each element
- Lines become closer at higher frequencies
- Set of lines representing transitions to a particular level
Differences
- Bright lines on black background OR black lines on coloured background
Information
- Description
- AS level Chemistry (Elements of Life) Mind Map on Absorption and Emission Spectra, created by poppyekoronka on 21/05/2014.
- Created by
- poppyekoronka
- Views
- 107
- Rating