
Notes
Advanced Statistics
Content of the notes (20)
Page 1
Research Design and Statistics
Each IV can be one of two types of design:
Repeated measures / within subjects
Independent measures/ between subjects
Page 2
Page 3
Type I and type II errors
Type I error
Finding a significant result when in fact there is no difference
Type II error
Finding a non-significant result when in fact there is a difference
We cannot know if we have made one of these errors
But smaller p-values mean Type I error is less likely
Page 4
Parametric tests: Assumptions
Normal distribution of residuals
Eyeballing histograms or residual plots,
Statistical tests
If violated use a non-parametric test (if there is one)
Homogeneity of Variance
Each independent group should have similar spread of data (variance)
Check using Levene’s test
f violated use a non-parametric test or transform your data
Sphericity (special case of homogeneity of variance for repeated measure with more than 2 levels)
Check using Mauchly’s test
If violated use corrected values (and to be safe you can just always do this)
Page 5
T-tests
Look for a difference between means
Use with ONE IV with TWO levels/conditions
Two main types of t-test
Independent samples t-test:
used when your IV is INDEPENDENT samples
2. Paired samples t-test:
used when your IV is REPEATED samples
With both types of t-test: t(df) = t value, p = sig. value, d = ?
Page 6
ANOVA
We have ONE IV with MORE than TWO levels/conditions
One-way ANOVA: One IV with 3+ conditions
OR
We have MORE than ONE IV
Two-way ANOVA - Two IV’s with 2+ conditions
Three-way ANOVA - Three IV’s with 2+ conditions
N-way ANOVA…
Design:
Independent / between subjects ANOVA
– all IV’s are independent measures
Repeated / within subjects ANOVA
– all IV’s are repeated measures
Mixed measures ANOVA
– some IV’s are independent measures, some are repeated measures
Report F(df for the effect, df error)=F value, p=sig. value, etasquared.
Page 7
Variance
UNSYSTEMATIC VARIANCE
Looking at the deviation of each point to the group mean (residual) – gives us variance for each group
SYSTEMATIC VARIANCE
Differences between each mean and the grand mean tells us how far away each mean is from being the same
ANOVA
Hence ANOVA uses the:
Differences between each group mean and the grand mean to work out systematic variance
Differences between each individual data point and the group mean of that point to work out unsystematic variance
F (F-ratio test) which is the test statistic used by ANOVA is: F = systematic variance unsystematic variance
Page 8
ANOVA:
Main effects and interactions
Main effects
Tells you whether there is a difference between the conditions of your independent variable
When there are 2+ IV’s, main effects are reported for each IV
Interactions
Only given when there are 2+ IV’s
Looks at the whether the effect of one IV depends on the level of another.
Another way of thinking about interactions: differences between sub-groups are different in different groups.
Page 9
ANOVA: Post-hoc tests
A significant finding tell us that there is a difference, but where is the difference?
Compares each level with each other level
Like running multiple t-tests
But post-hocs are corrected for elevated chance of a Type I error
Bonferroni correction
p value multiplied by the number of comparisons
Page 10
Effect size
Total amount of variance in the DV that is explained by the IV
How is this different from p?
The p value relates to the strength of evidence for the existence of an effect, not how big the effect is
The effect size looks at how much of the variance is explained on a standardised measure by the manipulation
Page 11
Confidence interval on the effect size
If the confidence interval on the effect size excludes zero, then we are confident there is an effect.
Here, we are only confident Intervention 1 is effective
Page 12
Regression
Regression lets us ask and answer ‘what is the best predictor of…’ or ‘by how much will the outcome change if predictor changes?’
outcome = (coefficient * predictor )+ intercept
The predictor variable is plotted on the x axis
The outcome variable is plotted on the y axis
The coefficient of “the predictor” is the slope of the line
The intercept is the value at which the line crosses the y axis
Useful properties of a General Linear model, given enough data, the numbers of both categorical and continuous predictors are theoretically unrestricted.
Page 13
Simple regression
To keep it simple, we’ll start out with just one predictor: advertising budget.
This essentially says how well the predictor predicts the DV
It is the proportion of variability in the DV that is explained by the predictor
What percentage of the variation in Ticket Sales can be predicted from knowing the Advertising Budget?
Adjusted R square value: 31% of the variation in Ticket Sales is predictable from knowing Advertising Budget
Looking at your results
ANOVA table tells us
Does the predictor have predictive power over the outcome?
Does the advertising budget predict the ticket sales?
should this be significant ( p < .05) it says the regression equation does explain a significant amount of the variation
Page 14
Multiple regression:
Each of the Sig values tell us whether that predictor is contributing significantly to the model
Standardised coefficients Beta tells us which predictor contributes most to the outcome
When running a multiple regression analysis which of the following assumptions are important? Multi-collinearity, dependent variable at interval
Page 15
Linearity
Linear regression. General linear model.
This means a straight line.
Most easily checked visually by plotting residuals
Page 16
For checking homogeneity of variance and normality
Many different types of histograms and scatter plots that can be looked at.
For you just two are important:
– Histogram of residuals for checking normal distribution
– Scatter plot of residuals against fitted/predicted values, for checking homogeneity of variance (other problems can also be detected)
Page 17
Confidence Intervals
Give an indication of the true likely effect of a population
95% confidence intervals
Give us a range (direction of effect)
Neg (harmful), Trivial, Positive (beneficial)
Populationally mean is between this range
Page 18
Nominal
Distinct categories are represented
No relationship or order between them
Called binary when just 2 categories
Ordinal
Ordered categories or ranked items
However, size of difference is not meaningful
Interval
Data you can measure
The size of difference between values is meaningful
Ratio
Meaningful definition of zero value
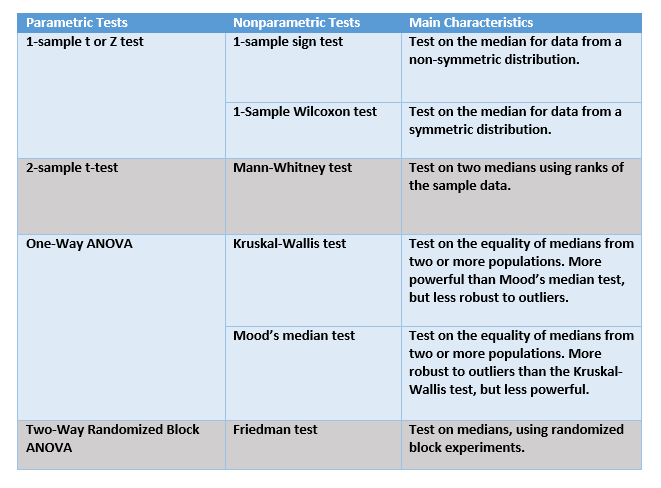
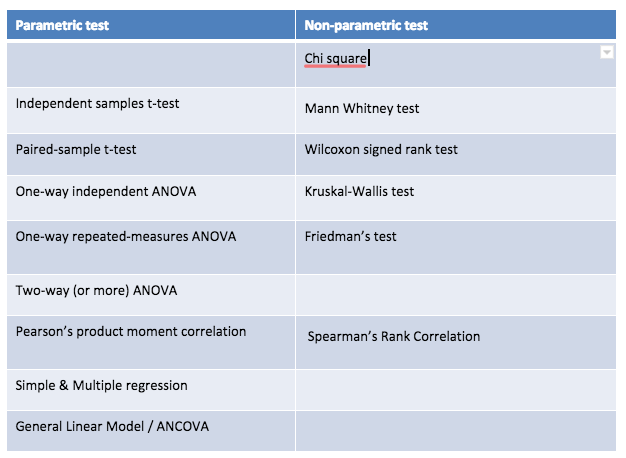
Nominal and ordinal are non-parametric statistics (do not use a T-test).
Ratio and interval a parametric test is possible.
Page 19
Page 20
Information
- Description
- Note on Advanced Statistics , created by Ellie Padgett on 07/12/2018.
- Created by
- Ellie Padgett
- Views
- 2
- Rating