
Notes
Statistics Ch 3
Content of the notes (2)
Page 1
Statistics 3.1
Compute the mean of a data set
Arithmetic mean/mean- average
Mean=sum of data points/# of data points
We will round the mean to one more decimal place than the
Σ x=x1+x2+...+xn
Sample mean: mean of a sample x x̅
Population mean: mean of the population μ
Measure of center
Compute the median of a data set
Median: number that splits data set in half
Measure of center
Compare the properties of the mean and median
The mean is influenced by more extreme values than the median
Because of this the median is resistant
If the data is skewed left the median will be left of the mean, if is is symmetric it will be the same and if it is skewed right then the median will be right of the mean
Find the mode of a data set
The mode is the value that appears most frequently
If two or more are tied for most frequent, they are all considered modes
If no value appears more than once, we say that the data set has no mode
Approximate the mean with grouped data
Approximating the mean with grouped data: 1) compute the midpoint of each class. The midpoint of a class is found by taking the average of the lower class limit and the lower limit of the next larger class. For the last class, there is no next larger class, but we use the lower limit that the next larger class would have had, 2) For each class, multiply the class midpoint by the class frequency, 3) add the products Midpoint x Frequency over all classes, 4) Divide the sum obtained in Step 3 by the sum of the frequencies
Page 2
Statistics 3.2
Compute the range of a data set
The range of a data set is the difference between the largest value and the smallest value
range=largest value-smallest value
Compute the variance of a population and a sample
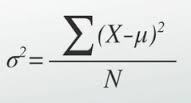
The variance is a measure of how far the values in a data set are from the mean, on average
x-mu (deviation)
The average of the squared deviation is the population variance
Data values from a sample use the sample variance (same formula but N-1)
Compute the standard deviation of a population and a sample
The square root of the variance is the standard deviaition
The standard deviation is not resistant
Approximate the standard deviation with grouped data
Step 1: Compute the midpoint of each class. The midpoint of a class is found by taking the average of the lower class limit and the lower class limit of the next larger class. Then compute the mean as described in Scetion 3.1
Step 2: For each class, subtract the mean from the class midpoint to obtain Midpoint-Mean
Step 3: For each class, square the difference obtained in step 2 to obtain (Midpoint-Mean)^2 and multiply by the frequency to obtain (Midpoint-Mean)^2 x frequency
Step 4: Add the products (Midpoint-Mean)^2 x frequency over all classes
Step 5: Compute the sum of the frequencies n. To compute the population variance, divide the sum obtained in step 4 by n. To compute the sample variance, divide the sum obtained in Step 4 by n-1
Step 6: Take the square root of the variance to step 5. The result is the standard deviation
Use the Empirical Rule to summarize data that are unimodel and approximately symmetric
The Empirical Rule:
68%, 95%, 99.7%
Use Chebyshev's Inequality to describe a data set
Chebyshev's Inequality:
K=2 (75%) or K=3 (88.9%)
Compute the coefficient of variation
Coefficient of variation:
CV=standard deviation/mean
Information
- Description
- Note on Statistics Ch 3, created by Sarah Paige on 02/02/2017.
- Created by
- Sarah Paige · Feb 2017
- Updated
- Feb 3, 2017
- Views
- 0
- Rating