
Notes
Supply Curve for Labour and the Economy (Movements Along and Shifts)
Content of the notes (1)
Page 1
INDIVIDUAL BACKWARD BENDING SUPPLY CURVE FOR LABOUR
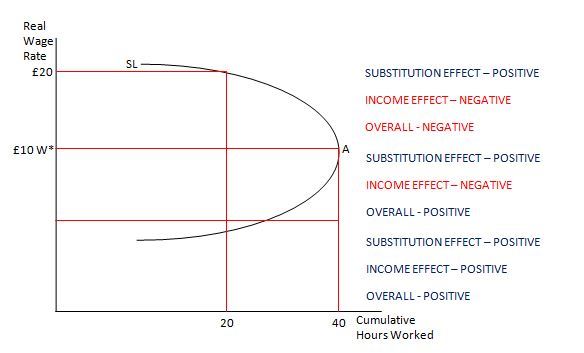
If W* is £10 per hour x 40 hours per week, monthly earnings are £400
If wage is doubled to £20 hours per hour one would work 20 hours to achieve their target level of income
This is an individual curve so the shape varies depending on the strengths of the two effects
From the diagram we can see that initially as the real wage offered increases the individual is willing to work more hours
However once the target level of income (point A) has been achieved any further in the real wage will be met by less hours being worked
This is due to the fact that after the target level of income has been achieved, the individual increasingly sees leisure as a luxury good
If the real wage is doubled the individual would be willing to work half the time
In order to fully appreciate the relationship we need to first appreciate the relationship between - the substitution effect and the concept on opportunity cost and the income effect and the target level of income
SUBSTITUTION EFFECT
As real wage offered increases the opportunity cost of choosing leisure over work gets greater
As such people will increasingly choose to work more hours at the expense of leisure
Always POSITIVE
INCOME EFFECT
Initially as the wage offered is increased this acts as an incentive for the individual to work more hours as their ability to achieve their target level of income has increased
There comes a point however where the income effect becomes negative but its insufficient to outweigh the positive substitution effect
This occurs as an individuals income begins to approach their target level of income
Once this level has been achieved the negative income effect outweighs the positive substitution effect and the supply curve goes backwards (once this level is achieved more value is placed on leisure and hours worked fall)
If the wage doubled the individual would work half of the time whilst maintaining their target level of income
THE SUPPLY OF LABOUR FOR AN ECONOMY
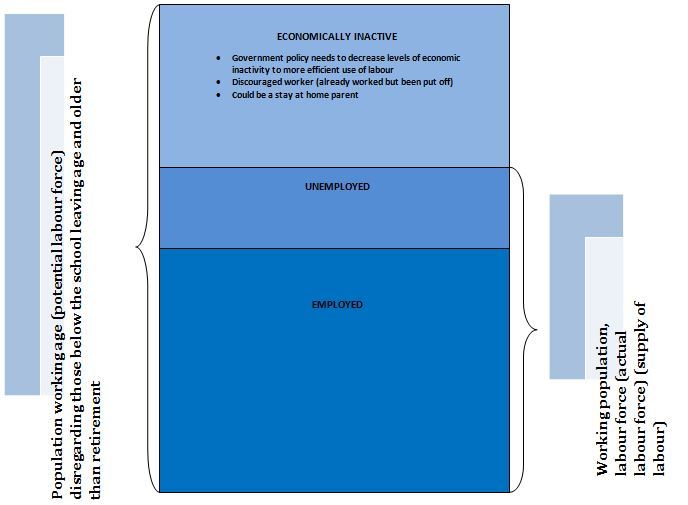
The supply of labour available to an economy is influenced by the size of the population. However it would be wrong to suggest that the supply of kabour is the same sizeof the population
THE ACTUAL LABOUR FORCE:- includes individuals who are employed and those individuals actively seeking employment
THE POTENTIAL LABOUR FORCE:- includes the actual labour force and the economically inactive
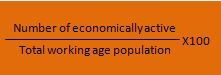
THE PARTICIPATION RATE:- the proportion of the working age population who are economically active and is calculated by using the following formula which is expressed as a percentage
MOVEMENTS ALONG A SUPPLY CURVE FOR LABOUR
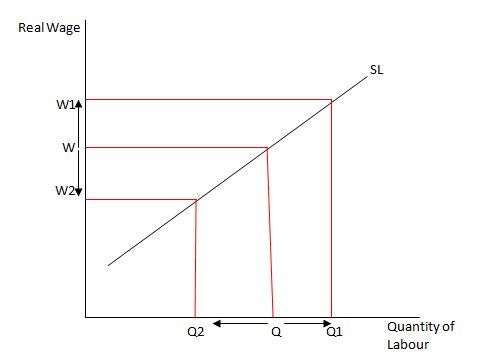
At the increase from W to W1 there is an extension along SL, a decrease in W to W2 causes a contraction along SL
A change in the real wage will cause a movement along the existing supply curve and that there is indeed a positive relationship between real wage and quantity supplied
SHIFTS IN THE SUPPLY CURVE FOR LABOUR
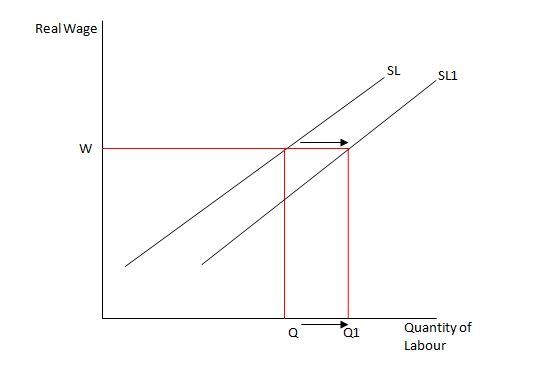
The real wage offered hasn't changed, however the number of people willing to work has increased; this may be due to the fact that:-
A change in the value placed on leisure time, if more value is placed on leisure time than overtime supply to all industries would decrease
A change in the working conditions/wage offered in an alternative industry (assuming occupational mobility - explain below diagram)
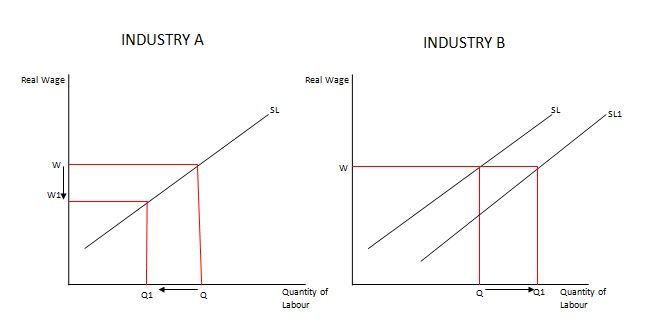
Artificial limits to an industries labour supply (eg through the introduction of minimum entry requirements or other legal barriers to entry)
Increasing the size of the working population. As the supply of the labour increased due to the increase in population one would expect a corresponding increase in the supply of labour
Changes in non-pecuniary benefits enjoyed by workers in the industry eg changes in job status/ changes in holiday entitlement
PECUNIARY BENEFITS monetary benefits gained from employment eg wages, bonus
NON-PECUNIARY BENEFITS non-monetary benefits gained from employment eg perceived job status, job satisfaction
NET ADVANTAGES of an occupation include monetary benefits, quasi-pecuniary benefits, and non-monetary advantages and disadvantages of an occupation
QUASI-PECUNIARY BENEFITS give workers a financial benefit without increasing wages eg staff discount, company car, private healthcare
Information
- Description
- A Level A2 Economics Note on Supply Curve for Labour and the Economy (Movements Along and Shifts), created by samyajahangir on 22/03/2015.
- Created by
- samyajahangir · Mar 2015
- Updated
- Aug 14, 2017
- Views
- 270
- Rating