
Notes
Sankey Diagrams
Content of the notes (1)
Page 1
Sankey diagrams are diagrams to show how the energy input into something is used. For example, if 100J (100 Joules) of electrical energy is input, and 90J is (wasted) heat energy and the other 10J is light energy, we could demonstrate it on a Sankey diagram, like this:
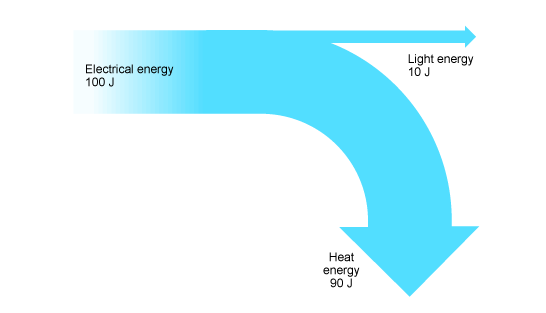
The width of the arrows symbolise how many joules are being used as that type of energy - say if on our diagram 1cm = 10J, we would make the arrow for heat energy 9cm long to show that the amount of electrical energy being transferred into heat energy is 90j.
Efficiency
Efficiency can be calculated using the formula: useful energy output / total energy input.
It can be measured in either percentage or decimal format.
Information
- Description
- Notes on how to work out efficiency and how to set out a Sankey diagram.
- Created by
- Quinn Quillfeather · Oct 2016
- Updated
- Oct 25, 2016
- Views
- 614
- Tags
- Rating