
Mapa mental
Unit 3 - Chapter 8
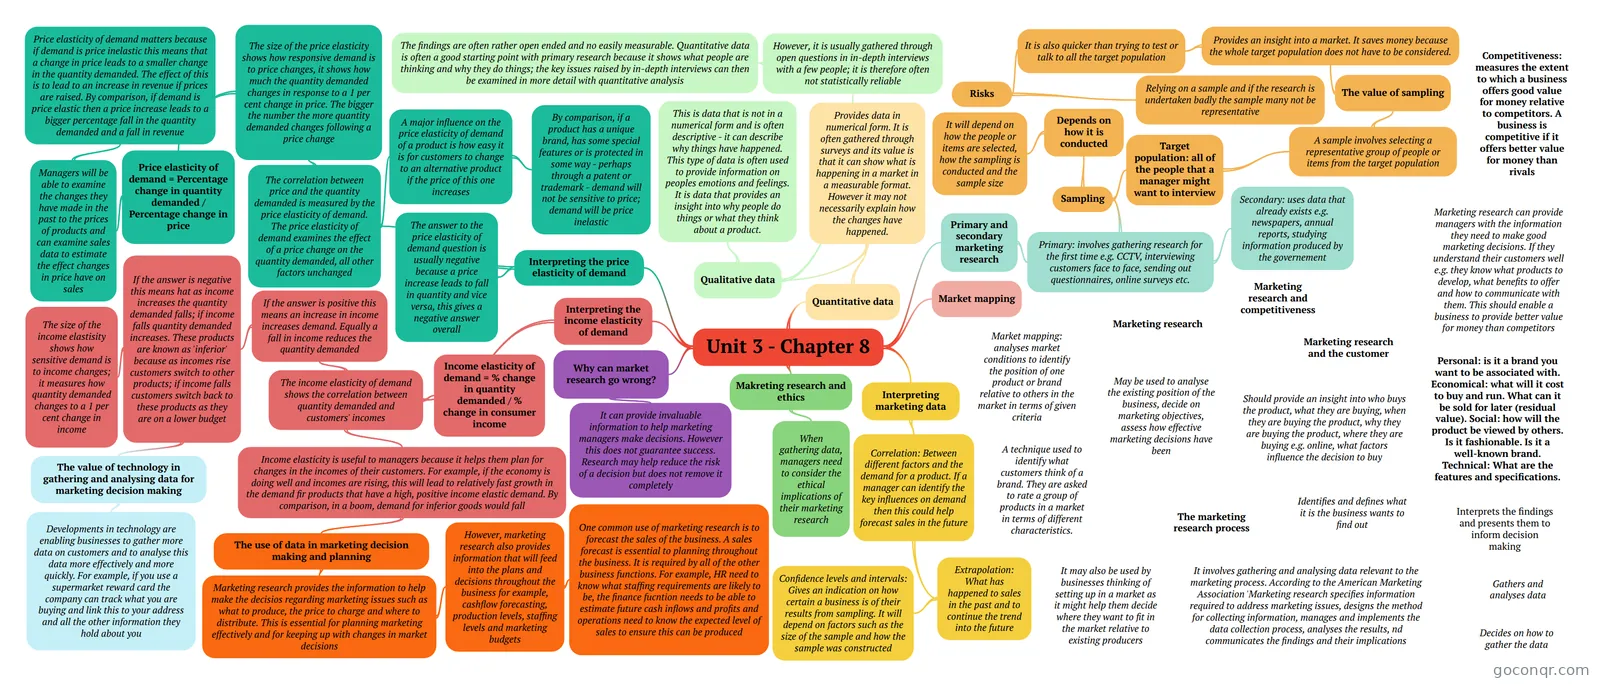
Mind map: Marketing research
Contenido del mapa
Unit 3 - Chapter 8
Primary and secondary marketing research
- Primary: involves gathering research for the first time e.g. CCTV, interviewing customers face to face, sending out questionnaires, online surveys etc.
- Secondary: uses data that already exists e.g. newspapers, annual reports, studying information produced by the governement
- Sampling
- Target population: all of the people that a manager might want to interview
- A sample involves selecting a representative group of people or items from the target population
- The value of sampling
- Provides an insight into a market. It saves money because the whole target population does not have to be considered.
- It is also quicker than trying to test or talk to all the target population
- Risks
- Relying on a sample and if the research is undertaken badly the sample many not be representative
- Risks
- It is also quicker than trying to test or talk to all the target population
- Provides an insight into a market. It saves money because the whole target population does not have to be considered.
- The value of sampling
- A sample involves selecting a representative group of people or items from the target population
- Depends on how it is conducted
- It will depend on how the people or items are selected, how the sampling is conducted and the sample size
- Target population: all of the people that a manager might want to interview
- Primary: involves gathering research for the first time e.g. CCTV, interviewing customers face to face, sending out questionnaires, online surveys etc.
Quantitative data
- Provides data in numerical form. It is often gathered through surveys and its value is that it can show what is happening in a market in a measurable format. However it may not necessarily explain how the changes have happened.
- Qualitative data
- This is data that is not in a numerical form and is often descriptive - it can describe why things have happened. This type of data is often used to provide information on peoples emotions and feelings. It is data that provides an insight into why people do things or what they think about a product.
- However, it is usually gathered through open questions in in-depth interviews with a few people; it is therefore often not statistically reliable
- The findings are often rather open ended and no easily measurable. Quantitative data is often a good starting point with primary research because it shows what people are thinking and why they do things; the key issues raised by in-depth interviews can then be examined in more detail with quantitative analysis
- Qualitative data
- Provides data in numerical form. It is often gathered through surveys and its value is that it can show what is happening in a market in a measurable format. However it may not necessarily explain how the changes have happened.
Market mapping
Interpreting marketing data
- Correlation: Between different factors and the demand for a product. If a manager can identify the key influences on demand then this could help forecast sales in the future
- Extrapolation: What has happened to sales in the past and to continue the trend into the future
- Confidence levels and intervals: Gives an indication on how certain a business is of their results from sampling. It will depend on factors such as the size of the sample and how the sample was constructed
- Extrapolation: What has happened to sales in the past and to continue the trend into the future
- Correlation: Between different factors and the demand for a product. If a manager can identify the key influences on demand then this could help forecast sales in the future
Interpreting the price elasticity of demand
- The correlation between price and the quantity demanded is measured by the price elasticity of demand. The price elasticity of demand examines the effect of a price change on the quantity demanded, all other factors unchanged
- The size of the price elasticity shows how responsive demand is to price changes, it shows how much the quantity demanded changes in response to a 1 per cent change in price. The bigger the number the more quantity demanded changes following a price change
- Price elasticity of demand = Percentage change in quantity demanded / Percentage change in price
- Managers will be able to examine the changes they have made in the past to the prices of products and can examine sales data to estimate the effect changes in price have on sales
- Price elasticity of demand matters because if demand is price inelastic this means that a change in price leads to a smaller change in the quantity demanded. The effect of this is to lead to an increase in revenue if prices are raised. By comparison, if demand is price elastic then a price increase leads to a bigger percentage fall in the quantity demanded and a fall in revenue
- Managers will be able to examine the changes they have made in the past to the prices of products and can examine sales data to estimate the effect changes in price have on sales
- Price elasticity of demand = Percentage change in quantity demanded / Percentage change in price
- A major influence on the price elasticity of demand of a product is how easy it is for customers to change to an alternative product if the price of this one increases
- By comparison, if a product has a unique brand, has some special features or is protected in some way - perhaps through a patent or trademark - demand will not be sensitive to price; demand will be price inelastic
- The size of the price elasticity shows how responsive demand is to price changes, it shows how much the quantity demanded changes in response to a 1 per cent change in price. The bigger the number the more quantity demanded changes following a price change
- The answer to the price elasticity of demand question is usually negative because a price increase leads to fall in quantity and vice versa, this gives a negative answer overall
- The correlation between price and the quantity demanded is measured by the price elasticity of demand. The price elasticity of demand examines the effect of a price change on the quantity demanded, all other factors unchanged
Interpreting the income elasticity of demand
- The income elasticity of demand shows the correlation between quantity demanded and customers' incomes
- Income elasticity of demand = % change in quantity demanded / % change in consumer income
- If the answer is positive this means an increase in income increases demand. Equally a fall in income reduces the quantity demanded
- If the answer is negative this means hat as income increases the quantity demanded falls; if income falls quantity demanded increases. These products are known as 'inferior' because as incomes rise customers switch to other products; if income falls customers switch back to these products as they are on a lower budget
- The size of the income elastisity shows how sensitive demand is to income changes; it measures how quantity demanded changes to a 1 per cent change in income
- The value of technology in gathering and analysing data for marketing decision making
- Developments in technology are enabling businesses to gather more data on customers and to analyse this data more effectively and more quickly. For example, if you use a supermarket reward card the company can track what you are buying and link this to your address and all the other information they hold about you
- If the answer is negative this means hat as income increases the quantity demanded falls; if income falls quantity demanded increases. These products are known as 'inferior' because as incomes rise customers switch to other products; if income falls customers switch back to these products as they are on a lower budget
- Income elasticity is useful to managers because it helps them plan for changes in the incomes of their customers. For example, if the economy is doing well and incomes are rising, this will lead to relatively fast growth in the demand fir products that have a high, positive income elastic demand. By comparison, in a boom, demand for inferior goods would fall
- The use of data in marketing decision making and planning
- Marketing research provides the information to help make the decisios regarding marketing issues such as what to produce, the price to charge and where to distribute. This is essential for planning marketing effectively and for keeping up with changes in market decisions
- However, marketing research also provides information that will feed into the plans and decisions throughout the business for example, cashflow forecasting, production levels, staffing levels and marketing budgets
- One common use of marketing research is to forecast the sales of the business. A sales forecast is essential to planning throughout the business. It is required by all of the other business functions. For example, HR need to know what staffing requirements are likely to be, the finance fucntion needs to be able to estimate future cash inflows and profits and operations need to know the expected level of sales to ensure this can be produced
- However, marketing research also provides information that will feed into the plans and decisions throughout the business for example, cashflow forecasting, production levels, staffing levels and marketing budgets
- Marketing research provides the information to help make the decisios regarding marketing issues such as what to produce, the price to charge and where to distribute. This is essential for planning marketing effectively and for keeping up with changes in market decisions
- The use of data in marketing decision making and planning
- The income elasticity of demand shows the correlation between quantity demanded and customers' incomes
Why can market research go wrong?
- It can provide invaluable information to help marketing managers make decisions. However this does not guarantee success. Research may help reduce the risk of a decision but does not remove it completely
Makreting research and ethics
- When gathering data, managers need to consider the ethical implications of their marketing research
Información
- Descripción
- A level Business Studies Mapa Mental sobre Unit 3 - Chapter 8, creado por Megan Farrelly el 05/12/2016.
- Creado por
- Megan Farrelly
- Visitas
- 0
- Valoración