
Mapa mental
Business Reporting, Visual Analytics & Dashboards
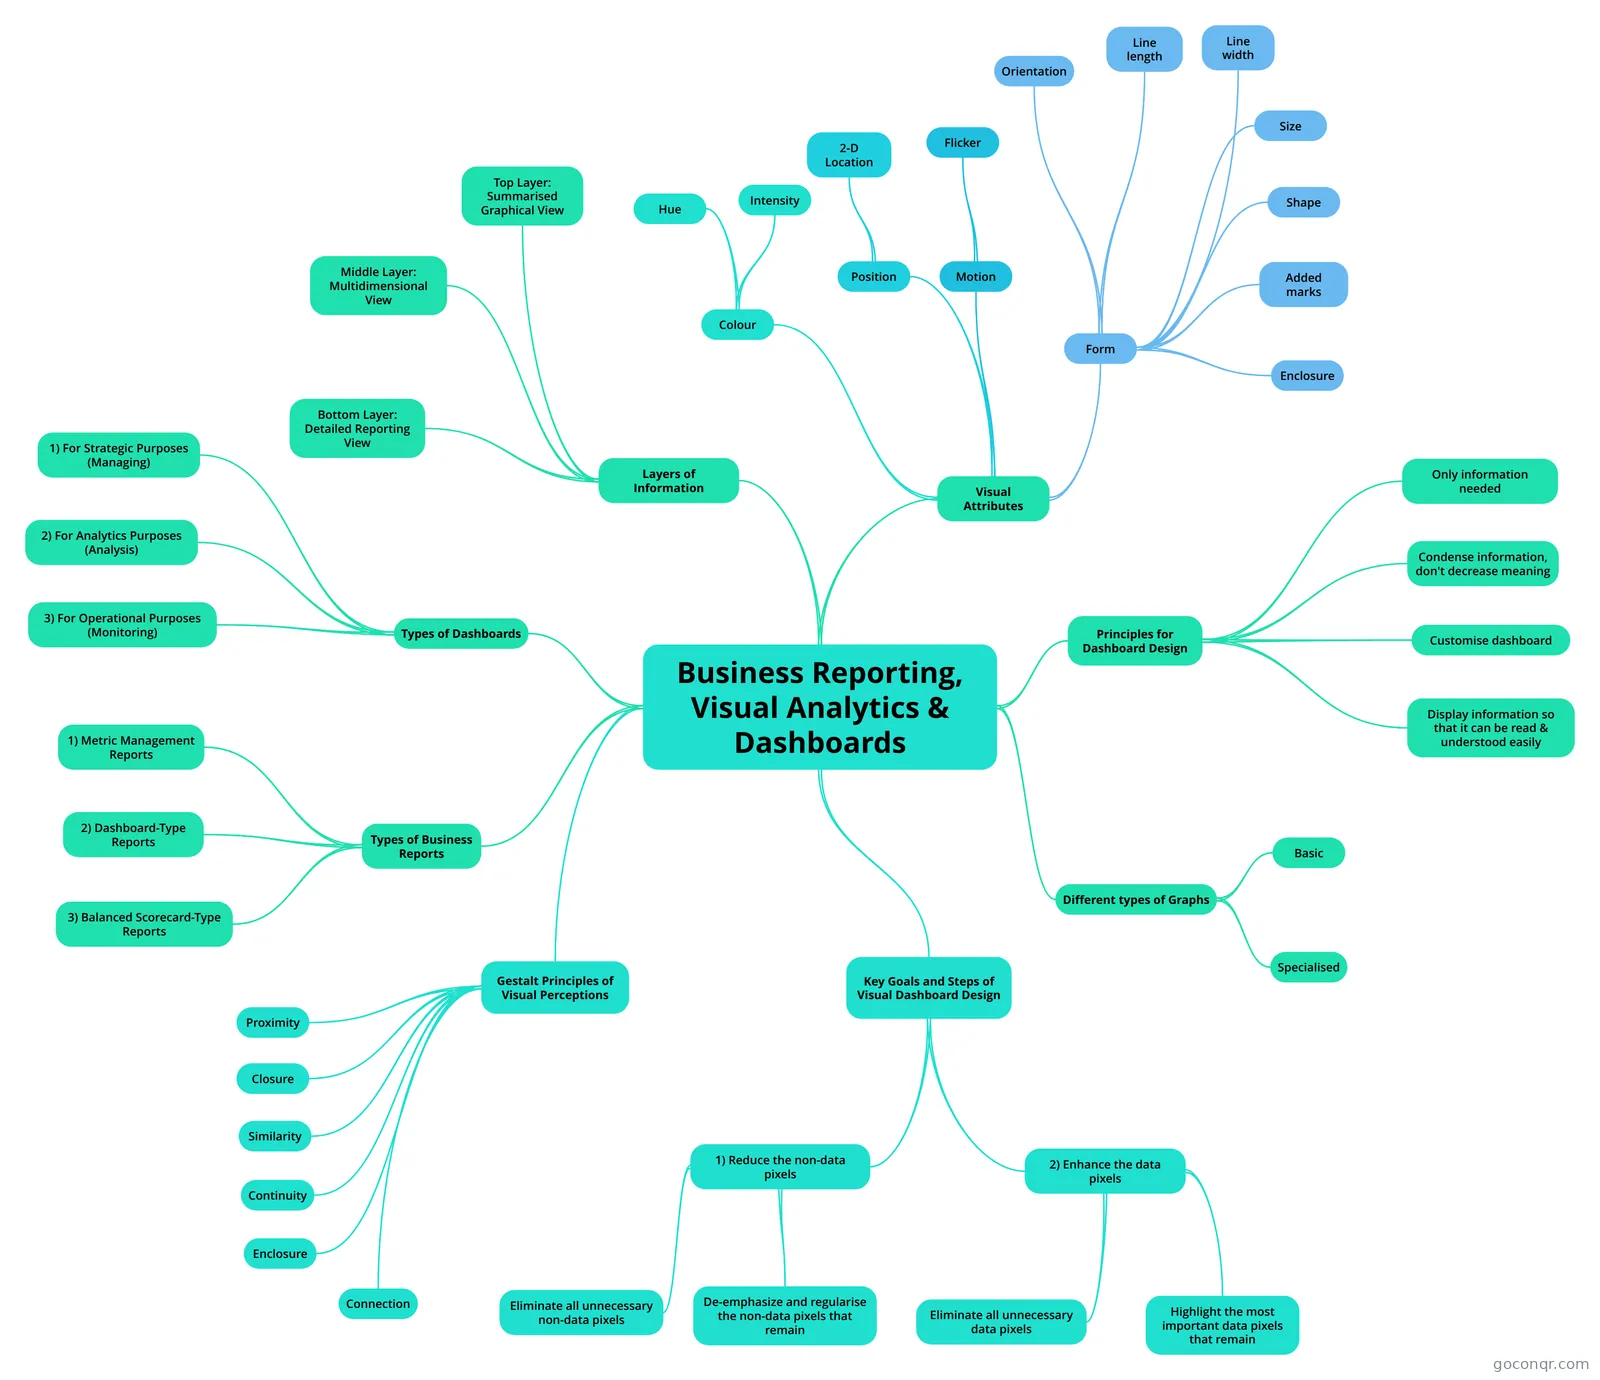
Mind map: Business reporting, visual analytics & dashboards
Contenido del mapa
Business Reporting, Visual Analytics & Dashboards
Types of Business Reports
- 1) Metric Management Reports
- 2) Dashboard-Type Reports
- 3) Balanced Scorecard-Type Reports
Types of Dashboards
- 1) For Strategic Purposes (Managing)
- 2) For Analytics Purposes (Analysis)
- 3) For Operational Purposes (Monitoring)
Layers of Information
- Bottom Layer: Detailed Reporting View
- Middle Layer: Multidimensional View
- Top Layer: Summarised Graphical View
Visual Attributes
- Colour
- Hue
- Intensity
- Form
- Orientation
- Line length
- Line width
- Size
- Shape
- Added marks
- Enclosure
- Position
- 2-D Location
- Motion
- Flicker
- Colour
Principles for Dashboard Design
- Only information needed
- Condense information, don't decrease meaning
- Customise dashboard
- Display information so that it can be read & understood easily
Different types of Graphs
- Basic
- Specialised
Gestalt Principles of Visual Perceptions
- Proximity
- Closure
- Similarity
- Continuity
- Enclosure
- Connection
Key Goals and Steps of Visual Dashboard Design
- 1) Reduce the non-data pixels
- Eliminate all unnecessary non-data pixels
- De-emphasize and regularise the non-data pixels that remain
- 2) Enhance the data pixels
- Highlight the most important data pixels that remain
- Eliminate all unnecessary data pixels
- 1) Reduce the non-data pixels