
Mapa mental
Patterns & Trends in Crime
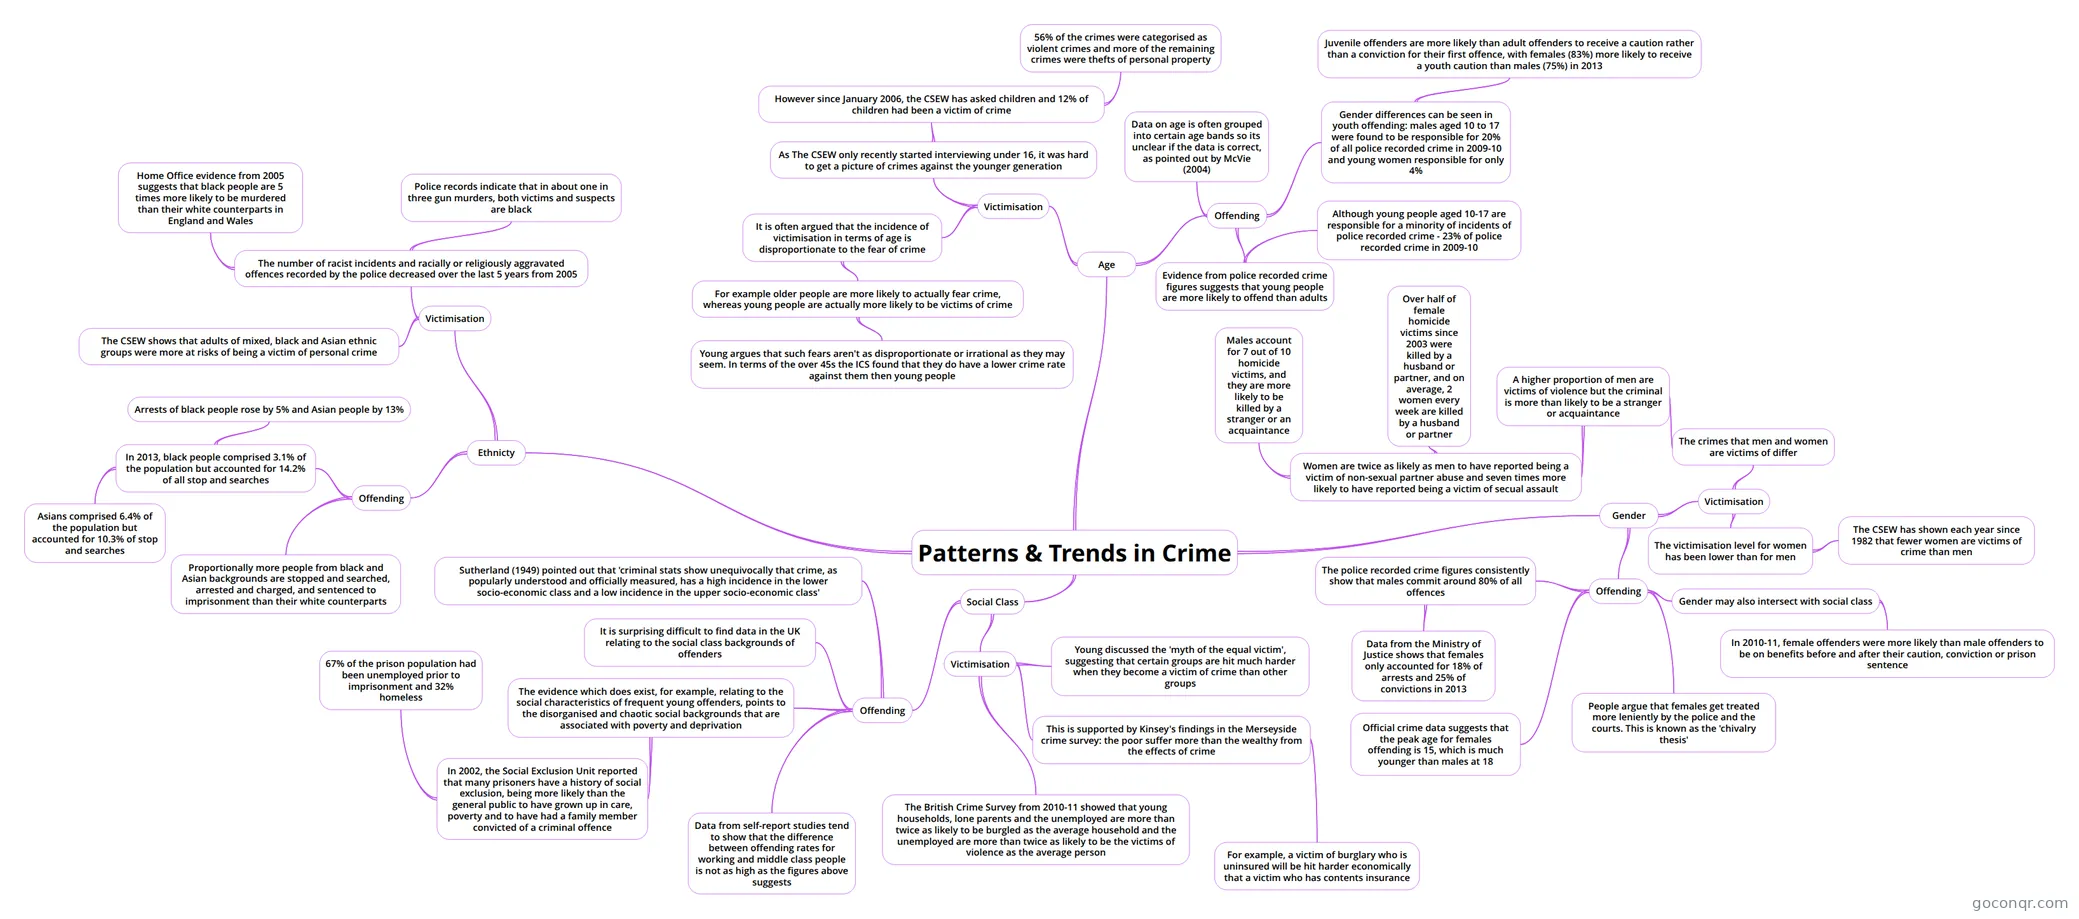
Mind map: Patterns and trends in crime
Contenido del mapa
Patterns & Trends in Crime
Social Class
- Offending
- Sutherland (1949) pointed out that 'criminal stats show unequivocally that crime, as popularly understood and officially measured, has a high incidence in the lower socio-economic class and a low incidence in the upper socio-economic class'
- It is surprising difficult to find data in the UK relating to the social class backgrounds of offenders
- The evidence which does exist, for example, relating to the social characteristics of frequent young offenders, points to the disorganised and chaotic social backgrounds that are associated with poverty and deprivation
- In 2002, the Social Exclusion Unit reported that many prisoners have a history of social exclusion, being more likely than the general public to have grown up in care, poverty and to have had a family member convicted of a criminal offence
- 67% of the prison population had been unemployed prior to imprisonment and 32% homeless
- In 2002, the Social Exclusion Unit reported that many prisoners have a history of social exclusion, being more likely than the general public to have grown up in care, poverty and to have had a family member convicted of a criminal offence
- Data from self-report studies tend to show that the difference between offending rates for working and middle class people is not as high as the figures above suggests
- Victimisation
- The British Crime Survey from 2010-11 showed that young households, lone parents and the unemployed are more than twice as likely to be burgled as the average household and the unemployed are more than twice as likely to be the victims of violence as the average person
- Young discussed the 'myth of the equal victim', suggesting that certain groups are hit much harder when they become a victim of crime than other groups
- This is supported by Kinsey's findings in the Merseyside crime survey: the poor suffer more than the wealthy from the effects of crime
- For example, a victim of burglary who is uninsured will be hit harder economically that a victim who has contents insurance
- Offending
Gender
- Offending
- The police recorded crime figures consistently show that males commit around 80% of all offences
- Data from the Ministry of Justice shows that females only accounted for 18% of arrests and 25% of convictions in 2013
- Official crime data suggests that the peak age for females offending is 15, which is much younger than males at 18
- Gender may also intersect with social class
- In 2010-11, female offenders were more likely than male offenders to be on benefits before and after their caution, conviction or prison sentence
- People argue that females get treated more leniently by the police and the courts. This is known as the 'chivalry thesis'
- The police recorded crime figures consistently show that males commit around 80% of all offences
- Victimisation
- The victimisation level for women has been lower than for men
- The CSEW has shown each year since 1982 that fewer women are victims of crime than men
- The crimes that men and women are victims of differ
- A higher proportion of men are victims of violence but the criminal is more than likely to be a stranger or acquaintance
- Women are twice as likely as men to have reported being a victim of non-sexual partner abuse and seven times more likely to have reported being a victim of secual assault
- Males account for 7 out of 10 homicide victims, and they are more likely to be killed by a stranger or an acquaintance
- Over half of female homicide victims since 2003 were killed by a husband or partner, and on average, 2 women every week are killed by a husband or partner
- Women are twice as likely as men to have reported being a victim of non-sexual partner abuse and seven times more likely to have reported being a victim of secual assault
- A higher proportion of men are victims of violence but the criminal is more than likely to be a stranger or acquaintance
- The victimisation level for women has been lower than for men
- Offending
Age
- Offending
- Evidence from police recorded crime figures suggests that young people are more likely to offend than adults
- Although young people aged 10-17 are responsible for a minority of incidents of police recorded crime - 23% of police recorded crime in 2009-10
- Gender differences can be seen in youth offending: males aged 10 to 17 were found to be responsible for 20% of all police recorded crime in 2009-10 and young women responsible for only 4%
- Juvenile offenders are more likely than adult offenders to receive a caution rather than a conviction for their first offence, with females (83%) more likely to receive a youth caution than males (75%) in 2013
- Data on age is often grouped into certain age bands so its unclear if the data is correct, as pointed out by McVie (2004)
- Evidence from police recorded crime figures suggests that young people are more likely to offend than adults
- Victimisation
- It is often argued that the incidence of victimisation in terms of age is disproportionate to the fear of crime
- For example older people are more likely to actually fear crime, whereas young people are actually more likely to be victims of crime
- Young argues that such fears aren't as disproportionate or irrational as they may seem. In terms of the over 45s the ICS found that they do have a lower crime rate against them then young people
- For example older people are more likely to actually fear crime, whereas young people are actually more likely to be victims of crime
- As The CSEW only recently started interviewing under 16, it was hard to get a picture of crimes against the younger generation
- However since January 2006, the CSEW has asked children and 12% of children had been a victim of crime
- 56% of the crimes were categorised as violent crimes and more of the remaining crimes were thefts of personal property
- However since January 2006, the CSEW has asked children and 12% of children had been a victim of crime
- It is often argued that the incidence of victimisation in terms of age is disproportionate to the fear of crime
- Offending
Ethnicty
- Offending
- Proportionally more people from black and Asian backgrounds are stopped and searched, arrested and charged, and sentenced to imprisonment than their white counterparts
- In 2013, black people comprised 3.1% of the population but accounted for 14.2% of all stop and searches
- Asians comprised 6.4% of the population but accounted for 10.3% of stop and searches
- Arrests of black people rose by 5% and Asian people by 13%
- Victimisation
- The CSEW shows that adults of mixed, black and Asian ethnic groups were more at risks of being a victim of personal crime
- The number of racist incidents and racially or religiously aggravated offences recorded by the police decreased over the last 5 years from 2005
- Home Office evidence from 2005 suggests that black people are 5 times more likely to be murdered than their white counterparts in England and Wales
- Police records indicate that in about one in three gun murders, both victims and suspects are black
- Offending
Información
- Descripción
- A-Level (Crime and Deviance) Sociology Mapa Mental sobre Patterns & Trends in Crime, creado por Chloe Pilkington el 29/12/2016.
- Creado por
- Chloe Pilkington
- Visitas
- 2
- Valoración