
Apuntes
Standard Error (SEM)
Contenido del apunte (2)
Página 1
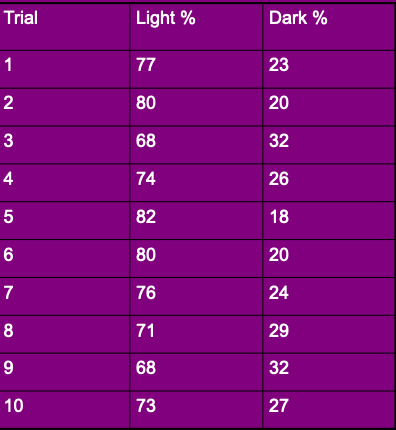
Perform data analysis following the data
Need to know: is there a statistically significant difference?
Is data truly different because of the independent variable, or are they diferent simply because of random chance
Mean: average value of the data
Light % - 74.9%
Dark % - 25.1%
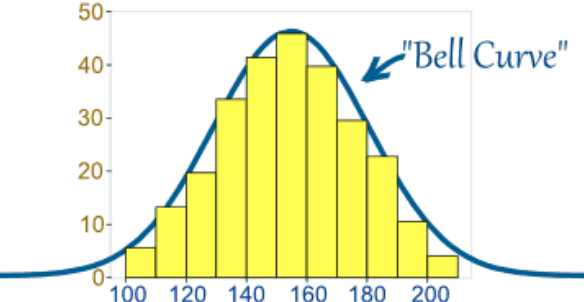
If enough measurements are made, data in biology often follows a normal distribution ("Bell curve")
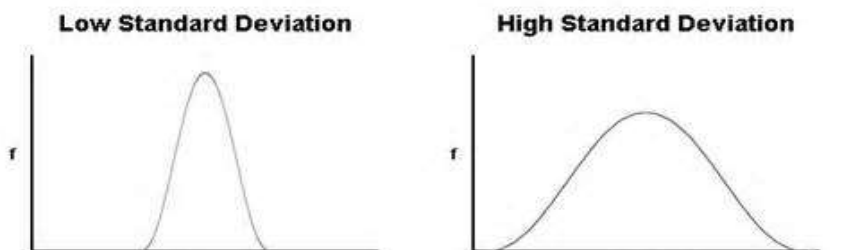
Standard Deviation: variance or spread of a sample
If SD close to 0, values are very close to mean value
If SD high, values are more spread out
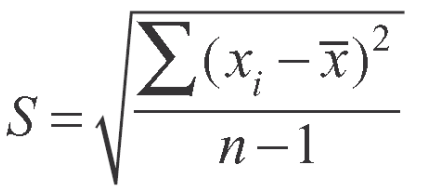
Formula to calculate SD: on the AP exam list, but you will not have to use it for calculations
X with the line over it = mean
In normal distribution, 68% of data will fall within +/- 1 SD, and 95% will fall within +/- 2 SD's
Página 2
Standard error of the mean (SEM): a statistical test that puts an error range around our data means

SEM bars: can be added to graphs
+/- SEM 1 = 67% confidence that range includes true population mean
+/- SEM 2 = 95% confidence that range includes true population mean
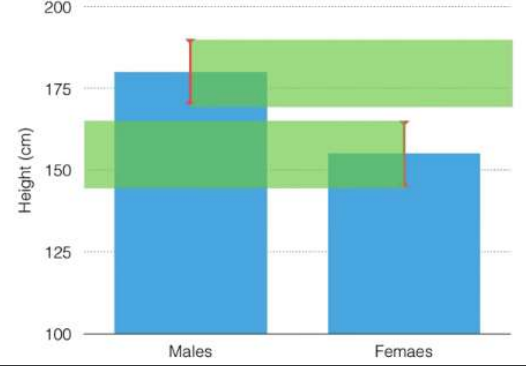
We can use the SE bars to analyze the data
Check to see if the error bars overlap
If error bars do not overlap: the two groups ARE significantly different from each other; experimental hypothesis supported, null rejected
If error bars do overlap: the two groups are NOT significantly different from each other; experimental hypothesis is not supported, null is supported