
Fichas
AP Statistics Exam Review
Fichas del conjunto (191)
- 1Categorical Dataqualitative data that identifies characteristics (hair color, preferences, etc).
- 2Numerical Dataquantitative data; split into discrete (counts) and continuous (measurements).
- 3Uni-variate Datadata that describes 1 characteristic of a population.
- 4Bi-variate Datadata that describes 2 characteristics of a population.
- 5Multivariate Datadata that describes >2 characteristics of a population.
- 6Relative Frequency Formulafrequency/n * 100
- 7Interquartile Range (IQR)Q3 - Q1
- 8Describing Categorical DataIdentify the highest frequency and lowest frequency,
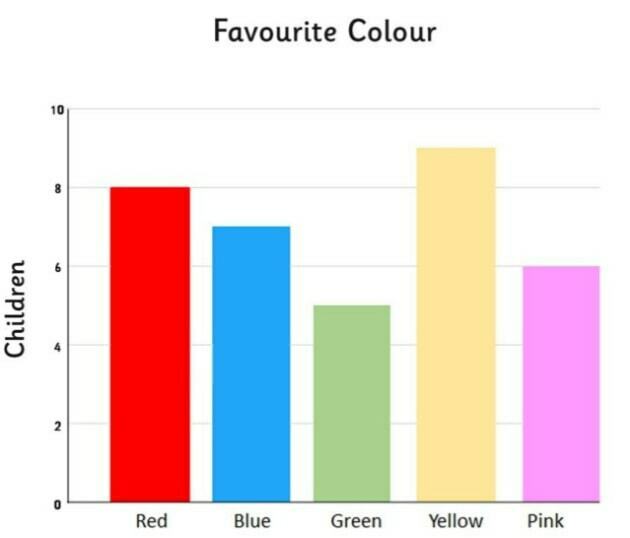
- 9Name this graph and identify the type of data it's used forBar Chart, Categorical Data
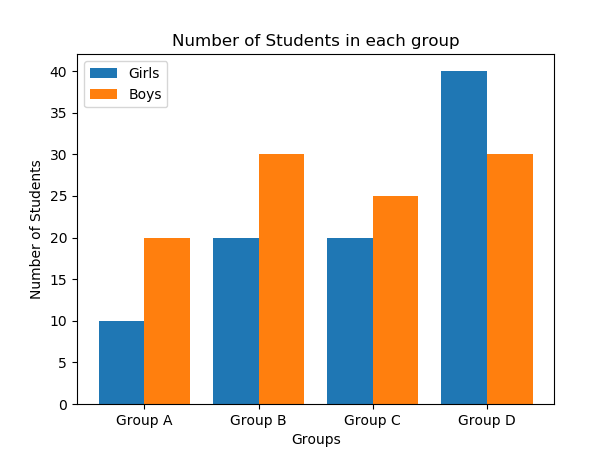
- 10Name this graph and identify the type of data it's used forDouble Bar Chart, Categorical Data w/ 2 or more Groups
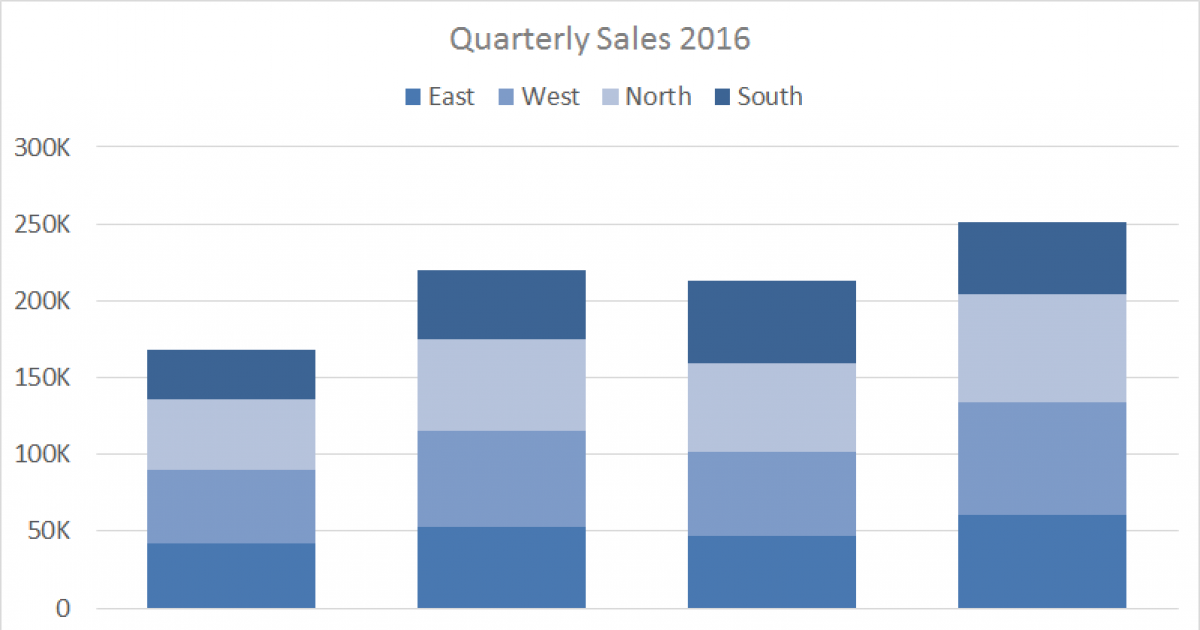
- 11Name this graph and identify the type of data it's used forStacked Bar Chart, Categorical Data (% to whole relationship)
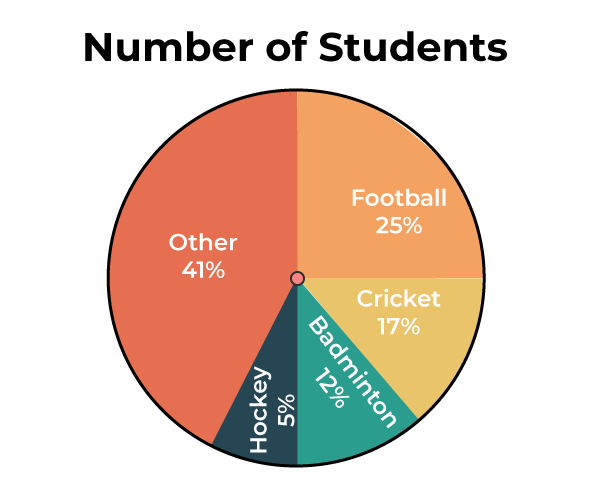
- 12Name this graph and identify the type of data it's used forPie Chart, Categorical Data (relation of part to whole)
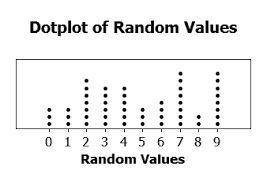
- 13Name this graph and identify the type of data it's used forDot Plot, Discrete Numerical Data
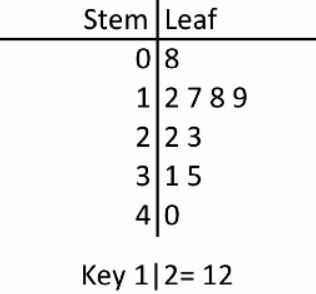
- 14Name this graph and identify the type of data it's used forStem-and-Leaf Plot, Univariate Numerical Data
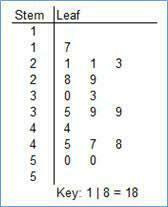
- 15Name this graph and identify the type of data it's used forSplit Stem-and Leaf Plot, Univariate Numerical Data w/ long list of leaves
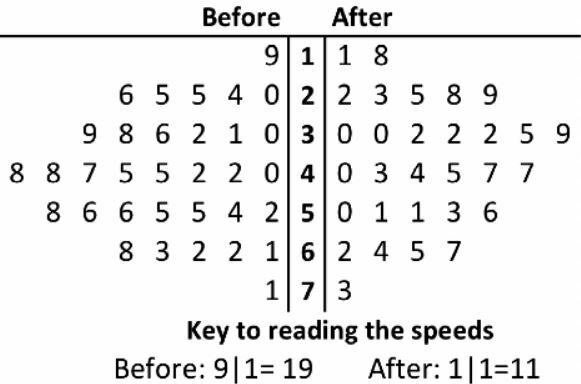
- 16Name this graph and identify the type of data it's used forBack-to-Back Stem-and-Leaf Plot, Univariate Numerical Data w/ 2 Grou[s
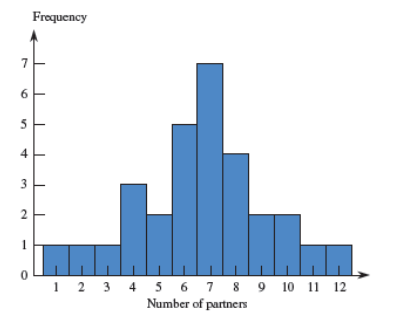
- 17Name this graph and identify the type of data it's used forDiscrete Histogram, Univariate Discrete Numerical Data
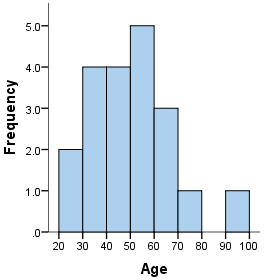
- 18Name this graph and identify the type of data it's used forContinuous Histogram, Univariate Continuous Numerical Data
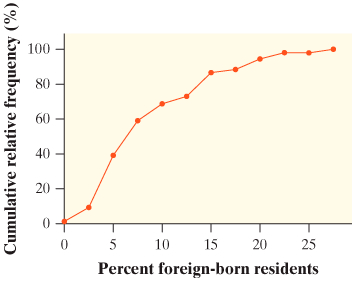
- 19Name this graph and identify what it's used forCumulative Relative Frequency Plot, Percentiles
- 20Parameterfixed value about a population.
- 21Statisticcalculated value from a sample.
- 22Degrees of Freedom# of observations free to vary; n - 1
- 23Left-Skewedtail on the left.
- 24Right-Skewedtail on the right.
- 25Uni-modal1 peak.
- 26Bi-modal2 peaks.
- 27Multimodal>2 peaks.
- 28Linear Transformation Rule+/- constant changes the mean.
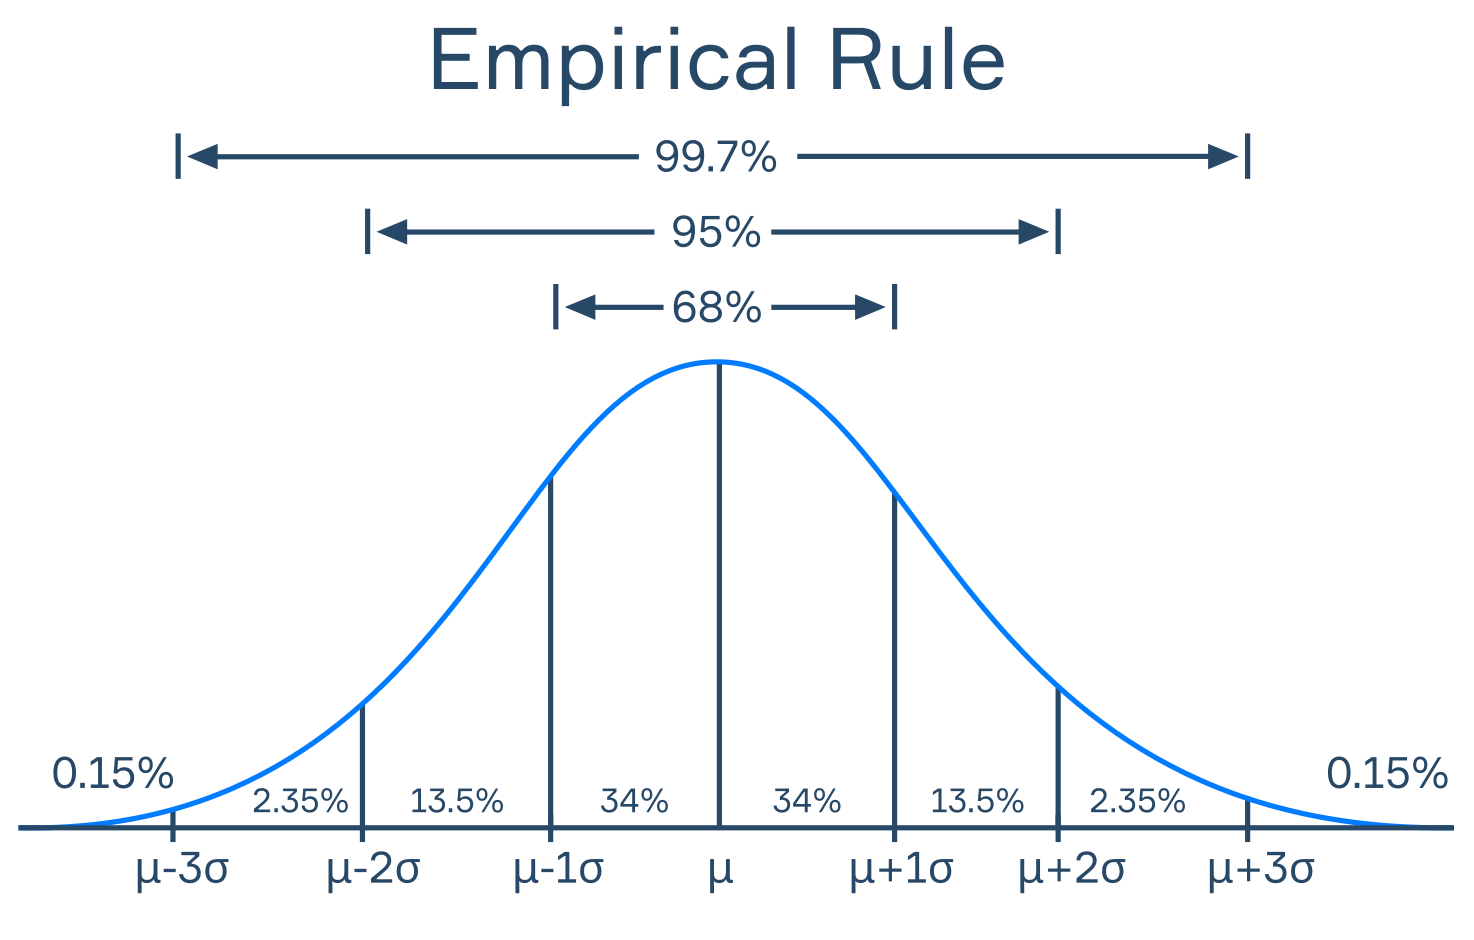
×/÷ a constant changes BOTH the mean and SD. - 29Empirical Rule68% of values are within 1 SD of the mean.
95% of values are within 2 SD of the mean.
99.7% of values are within 3 SD of the mean. - 30Combining Meansµa+b = µa + µb
µa-b = µa - µb - 31Combining Standard Deviationsσa±b = √σ²a + σ²b
- 32Trimmed Mean1. List values in order.
2. Do % trimmed(n)
3. Remove that many observations from BOTH ends.
4. Calculate mean with the new data set. - 33Boxplot Outliersany values < Q1 - 1.5(IQR) or > Q3 + 1.5(IQR)
- 345 Number Summary1. Minimum
2. Q1
3. Median
4. Q3
5. Maximum - 35Describing Numerical Data(SUCS)
Shape
Unusual values
Center
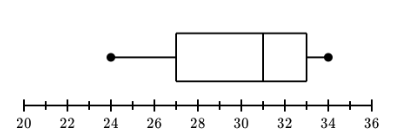
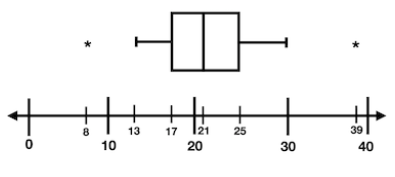
Spread - 36Name this graph and identify the type of data it's used forBoxplot, Univariate Numerical Data
- 37Name this graph and identify the type of data it's used forModified Boxplot, Univariate Numerical Data
- 38Identify the concept that this image displaysEmpirical Rule
- 39Countinghow many ways can an event occur? (order matters/doesn’t)
- 40Permutationorder ALWAYS matters.
- 41Combinationrder DOESN'T matter.
- 42Union (A ∪ B)the event of A OR B happening
- 43Intersection (A ∩ B)the event of A AND B happening
- 44Disjoint (Mutually Exclusive)2 events have no outcomes in common.
- 45Independentone event occurs and doesn’t change the probability of another event
- 46Hypothetical 1000suggests that the overall total will be 1000; used for probability tables only.
- 47Permutation Formulamath → prob → nPr
- 48Combination Formulamath → prob → nCr
- 49Disjoint Union FormulaP(A ∪ B) = P(A) + P(B)
- 50Non-Disjoint Union FormulaP(A ∪ B) = P(A) + P(B) - P(A ∩ B)
- 51Independent Intersection FormulaP(A ∩ B) = P(A) x P(B)
- 52Not-Independent Intersection FormulaP(A ∩ B) = P(A) x P(B|A)
- 53Probability Formula (Equallly Likely Outcomes)favorable outcomes/total outcomes
- 54Conditional ProbabilityP(B|A) = P(A ∩ B)/P(A)
- 55At Least One FormulaP(at least one) = 1 - P(Aᶜ)
- 56Exactly One FormulaP(exactly one) = P(A ∩ Bᶜ) + P(Aᶜ ∩ B)
- 57Explanatory Variablex-value/independent variable/causes the change.
- 58Response Variabley-value/dependent variable/the outcome of the change.
- 59Correlationrelationship between bivariate variables, whether positive/negative
- 60Correlation Coefficient (r)a quantitative assessment of STRENGTH and DIRECTION of a LINEAR relationship.
- 61Least Squares Regression Line (LSRL)the line of best fit, defined by ŷ = a + bx
- 62Extrapolationthe LSRL can’t be used for predictions made outside the range (too high/too low).
- 63Coefficient of Determination (r²)the proportion of variation in y determined by the linear relationship between x and y
- 64Residualvertical deviation between a point and the LSRL; y - ŷ
- 65Residual Plota scatter plot of (x, residual) pairs, determining whether a linear model is appropiate (linear pattern) or not (not a linear pattern).
- 66Influential Pointa point that if removed, changes the slope, y-intercept, and/or correlation substantially
- 67High Leverage Pointan influential point that changes the slope/y-intercept, affecting the LSRl directly.
- 68Outlieran influential point that changes r.
- 69a (y-int) Formulaa = ȳ - bx̄
- 70b (slope) Formulab = r(Sy/Sx)
- 71Interpreting the Correlation Coefficient (r)"There is a (weak/moderate/strong) (negative/positive) linear relationship between x and y."
- 72Interpreting the Slope"For a one unit increase in x, there is a predicted (increase/decrease) of b in y."
- 73Interpreting the Coefficient of Determination (r²)"Approximately r²% of the variation in y is explained by the LSRL of x on y."
- 74Identify the type of plot based on this imageScatter Plot
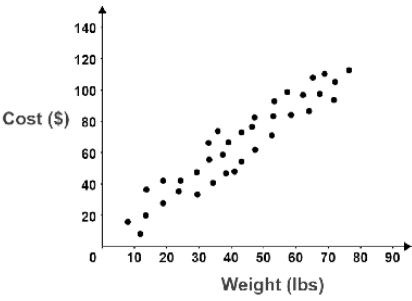
- 75Censusa complete count of the population.
- 76Sampling Designmethod used to choose a sample from the population.
- 775 Types of Sampling Design1. Simple Random Sample (SRS)
2. Stratified Random Sample
3. Systematic Random Sample
4. Cluster Sample
5. Multistage Sample - 78Sampling Framea list of every individual in the population.
- 79Simple Random Sampleeach individual/set of individuals has an EQUAL chance of being selected
- 80Stratified Random Samplepopulation is divided into STATA. An SRS is taken from each strata.
- 81Systematic Random Samplerandomly selects a BEGINNING POINT and follows a systematic approach.
- 82Cluster Samplerandomly picks a location and samples ALL from there.
- 83Multistage Samplesplits the process into stages and takes an SRS at each stage.
- 84Biasa systematic error in measuring the estimate; often favors certain outcomes.
- 856 Types of Bias1. Voluntary Response
2. Convenience Sampling
3. Undercoverage
4. Nonresponse
5. Response Bias
6. Wording of Questions - 86Voluntary ResponseSELF-SELECTION; people choose to respond because they have strong opinions.
- 87Convenience Samplingasking the easiest people to participate.
- 88Undercoveragewhen certain groups from the population are left out of the selection process.
- 89Nonresponsewhen an individual chosen refuses to participate/can’t be contacted.
- 90Response Biaswhen the respondent/interviewer causes bias by giving the wrong answer.
- 91Wording of Questionsthe use of big words/connotation can cause bias through confusion and indirect persuasion.
- 92Observational Studyobserving outcomes WITHOUT treatment.
- 93Experimentobserving outcomes AFTER treatment.
- 94Surveysimply asking respondents for data; NO observations or treatment.
- 95Experimental Unitthe individual to which the different treatments are assigned.
- 96Factorx; what are we testing?
- 97Response Variabley; what are we measuring?
- 98Levela specific value for the factor that splits it into different categories.
- 99Treatmenta specific experimental condition applied to the units.
- 100Control Groupa group used to compare the factor against.
- 101Placebodummy treatment with no effect.
- 102Blindingexperimental units don’t know which treatment they’re getting.
- 103Double Blindneither the experimental units nor the evaluator know which treatment was used.
- 104Confounding Variableoutside variable that affects the outcome but wasn’t considered in the beginning.
- 105Blockhomogeneous group formed by experimental units that share similar characteristics.
- 1063 Types of Experimental Design1. Completely Randomized
2. Randomized Block
3. Matched Pairs - 107Completely Randomizedexperimental units are assigned randomly to treatments.
- 108Randomized Blockexperimental units are blocked into homogeneous groups. Then, they are randomly assigned to treatments.
- 109Matched Pairsunits are paired up; one gets treatment A and the other automatically gets treatment B. OR, every experimental unit gets both treatments in a random order.
- 1105 Parts of a Simulation1. Model
2. Trial
3. Assumptions
4. Chart
5. Conclusion - 111ModelRandom Digit Table
“Let (digits) represent _______. “ - 112Trial“I will select (# of single digit/double digit numbers) to represent (each unit/group). I will record ____ and perform 5 trials.”
- 113Assumptions"P(probability) = #"
List all probabilities. - 114ChartDraw a chart displaying the trials and what you're testing. Then, sum up your results and divide it by the number of trials to achieve your approximately results.
- 115Conclusion“Based on my simulation, I estimate… (approximate results).”
- 116Binomial Distributiontests for the number of successes that can occur out of a given number of trials.
- 117Geometric Distributiontests for the number of trials until the 1st success is reached.
- 118pdfused when looking for exact values; P(X = x)
- 119cdfused when looking for cumulative values; P(X /≥ x)
- 120Mean of Linear Functionμᵧ = a + b(μₓ)
- 121Standard Deviation of Linear Functionσᵧ = |b|σₓ
- 122Unusual Distributiona continuous distribution with uniquely shaped density curve composed of triangles, rectangles, and/or trapezoids.
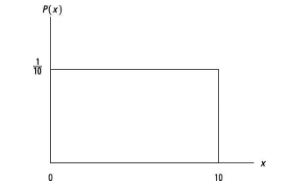
- 123Uniform Distributionan evenly distributed continuous distribution; shaped as a rectangle.
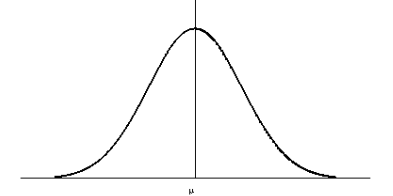
- 124Normal Distributiona continuous distribution with a symmetrical bell-shaped density curve defined by the mean and standard deviation.
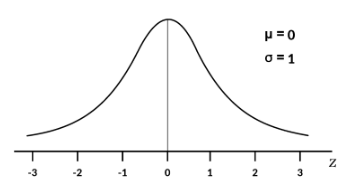
- 125Standard Normal Distributiona normal distribution with mean of 0 and standard deviation of 1.
- 126Normal Probability Plota scatter plot used to assess normality; linear pattern = distribution is approximately normal.
- 127Trapezoid FormulaA = 1/2(b1+b2)h
- 128Rectangle FormulaA = bh
- 129Triangle FormulaA = 1/2bh
- 130Height of Uniform Dist.1/(b - a)
- 131Probability of Uniform DistributionA = bh
- 132Mean of Uniform Dist.μₓ = (a+b)/2
- 133Standard Deviation of Uniform Dist.σₓ = √((b-a)²/12)
- 134Probability of Normal Dist.normcdf(l, u, μ, σ)
- 135X-value of Normal Dist.invNorm(a, μ, σ)
- 136Standardization Formulaz = (x -μ)/σ
- 137When SD increases, what happens to the normal curve?It flattens and spreads out.
- 138When SD decreases, what happens to the normal curve?It becomes narrower and thinner.
- 139Identify the type of density curve based on this imageUnusual Density Curve
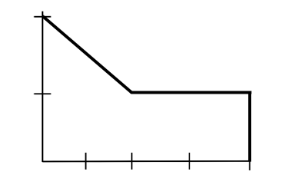
- 140Identify the type of density curve based on this imageUniform Density Curve
- 141Identify the type of density curve based on this imageNormal Density Curve
- 142Identify the type of density curve based on this imageStandard Normal Density Curve
- 143Sampling Variabilitythe observed value of the statistic depends on the particular sample selected from the population.
- 144Point Estimatestatistic used to estimate a parameter; often not close to the true value of the parameter.
- 145Confidence Intervalinterval of possible values for the population characteristic.
- 146Confidence Levelthe success rate of all confidence intervals that contain the true proportion p.
- 147Confidence Interval Default Formulapoint estimate ± critical value(standard error)
- 148Z-score Formula1. (1 - CL)/2 = a
2. 2nd → vars → invNorm(a, 0, 1, left) → Use the POSITIVE vers. - 149p̂number of successes/n
- 150Null Hypothesis (H0)a claim about the parameter initially assumed to be true.
- 151Alternate Hypothesis (Ha)competing claim against the null; what you are trying to prove.
- 152Test Statisticindicates how many standard deviations the statistic is from the parameter.
- 153P-valuethe probability of obtaining a test statistic as inconsistent as the null hypothesis, assuming it’s true.
- 154Level of Significance (α)he probability that we REJECT the null hypothesis, assuming it’s true.
- 155Test Statistic Default Formula(statistic - parameter)/standard error
- 156P-value for Proportions2nd → vars → normcdf(l, u, 0, 1)
- 157np TestsIf np ≥ 10 and n(1-p) ≥ 10), the sampling distribution is approximately normal.
- 158Type I Errorrejecting the null hypothesis when it’s true; denoted by alpha (α).
- 159Type II Errorfailing to reject the null hypothesis when it’s false; denoted by beta (β).
- 160Consequencesthe outcomes of making Type I/Type II errors.
- 161Relationship between α and βα and β are inversely related; as α gets bigger, β gets smaller, vise versa.
- 162Powerthe probability that the test rejects the null hypothesis when the alternate hypothesis is true (CORRECT).
- 163What happens if alpha increases?Power increases, Type I Error increases, and Type II decreases.
- 164What happens if n increases?Power increases and Type II Error decreases.
- 165What happens if P0 - Pa increases?Power increases and Type II Error decreases.
- 166np Tests (2-Prop)If n₁p₁ ≥ 10, n₁(1-p₁) ≥ 10), n₂p₂ ≥ 10, and n₂(1 - p₂) ≥ 10, the sampling distribution is approximately normal.
- 167Central Limit Theoremwhen n ≥ 30, the sampling distribution can be approximated by a normal curve.
- 168t Distributiona continuous distribution based on df; used when σ s unknown.
- 169df (t-Dist)df = n - 1
- 170P-value for Means2nd → vars → tcdf(l, u, df)
- 171T-score Formula1. (1 - CL)/2 = a
2. 2nd → vars → invT(a, df) → Use the POSITIVE vers. - 172Central Limit Theorem (2-Samp)when n₁ ≥ 30 and n₂ ≥ 30, the sampling distribution can be approximated by a normal curve.
- 173Pooled t Inferenceused when the variances of 2 populations are equal; σ₁ = σ₂
- 174df (Matched Pairs)df = n - 1
- 175df (2-Samp)Use 2-SampTTest and truncate the value.
- 176kthe number of categories.
- 177χ² testtests the counts of CATEGORICAL data; the 3 types are GOF, homogeneity, and independence
- 178GOF testmeasures univariate data for a single sample; uses a ONE-WAY table.
- 179Homogeneitymeasures univariate data for TWO/MORE SAMPLES; uses a two-way/more table.
- 180Independencemeasures BIVARIATE data for two/more samples; uses a two-way/more table.
- 181Expected Counts (GOF)n(proportion)
- 182Expected Counts (Homoegeneity and Independence)Make a matrix and use χ²-Test
- 183df (GOF)df = k - 1
- 184df (Homogeneity and Independence)df = (r- 1)(c - 1)
- 185P-value (Chi-squared)2nd → vars → χ²cdf(χ2, ∞, df)
- 186Identify the type of distribution based on this imageχ² Distribution
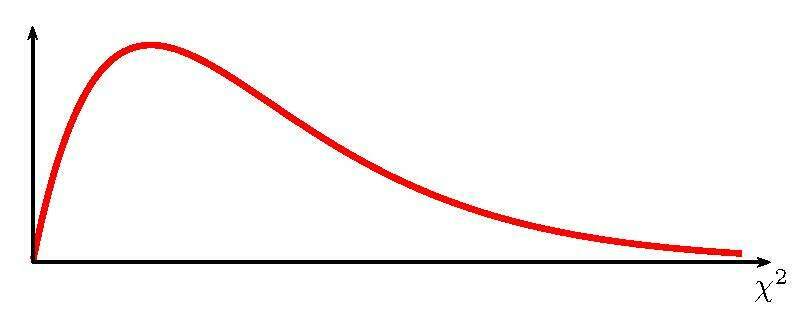
- 187Deterministic Relationshipa relationship in which the value of y is determined by the value of x.
- 188Error Variable (e)a random deviation that causes observed (x, y) points to avoid falling exactly on the population regression line.
- 189Test Statistic (LinReg)t = b/sb
- 190P-Value (LinReg)2nd → Vars → tcdf(l, u, df)
- 191df (LinReg)df = n - 2