
Flashcards
Exam Flash Cards
Cards in this deck (137)
- 1Bull SpreadPayoff: Long Call K1 + Short Call K2
Long Put K1 + Short Put K2
K1 < K2
Buying an option and selling the same type of option at a higher price.
Used when investors believe the price of an asset will increase between two strike prices but don't want to lose significantly if the asset price decreases and doesn't want to pay the premium for upside gain. - 2Bear SpreadPayoff: Short Call K1 + Long Call K2
Short Put K1 + Long Put K2
K1 < K2
Selling an option and buying the same type of option at a higher strike price.
Used when an investor believes the price of an asset will decrease between two strike prices but not decrease significantly and doesn't want to lose if stock increases. - 3Box SpreadPayoff: Long Call (put) Bull Spread + Long put (call) Bear Spread
Four options strategy consisting of buying a bull spread and buying a bear spread where one spread uses calls and the other uses identical puts.
Used to lend or borrow money. The payoff is fixed and known in advance equivalent to a zero coupon bond. - 4Ratio SpreadBuy m options at one strike price and selling n options at a different strike price where m does not equal n
- 5CollarPayoff: Long Put K1 + Short Call K2, K1 < K2
Created by purchasing a put at a lower strike price and selling a call at a higher strike price
Used when an investor wishes to benefit from the stock price decreasing. Investor exposed to negative payoff at expiry. - 6Collared StockPayoff: Long Collar + Long Stock
A combination of a purchased collar with a long stock. Min and max payoff K1 and K2 - 7StraddlePayoff: Long Put + Long Call same K
Created by purchasing both a call and a put with the same strike and time of expiration
Used when an investor believes the price of the underlying asset will experience large moves in either direction(high volatility). - 8StrangleLong Put K1 + Long Call K2, K1 < K2
Created by purchasing a put and a higher strike call each with the same time to expiry.
Use when an investor expects high volatility in the stock, but investor desires lower cost in a strangle than a straddle. K1 - 9Symmetric Butterfly SpreadBuy (K3-K2) K1 options
Buy (K2-K1) K3 options
Sell (K3-K1) K2 Options
Combination of options positions with equidistant strike prices.
Used when an investor believes the underlying asset's price will stay close to its current price but wants to be protected against potentially large losses - 10Asymmetric Butterfly SpreadBuy (K3-K2) K1 options
Buy (K2-K1) K3 options
Sell (K3-K1) K2 Options
Quantity Sold = Quantity Bought
Combination of options positions with nonequidistant strike prices.
Used when an investor believes the underlying asset's price will stay close to its current price but wants to be protected against potentially large losses - 114 Types of Asian OptionsArithmetic Strike
Arithmetic Price
Geometric Strike
Geometric Price - 12Asian Option PayoffsCall-Average Price: max[0,S*-K]
Call-Average Strike: max[0,S-S*]
Put-Average Price: max[0,K-S*]
Put-Average Strike: max[0,S*-S] - 13Put Call Parity-StocksCall - Put = Prepaid forward - Strike discounted by risk free
C-P=F^P(S) - Ke^(-r(T-t)) - 14Put call parity futuresCall - Put = Future price discounted by risk free - Strike discounted by risk free
C-P=Fe^(-r(T-t)) - Ke^(-r(T-t)) - 15Put Call Parity BondsCall - Put = Prepaid forward of Bond minus Strike discounted at risk free
C-P=F^P(B) - Ke^(-r(T-t))
F^P(B) = B_t - PV_t,T(Coupons) - 16Put Call Parity for Exchange OptionsCall - Put = Prepaid forward of A - Prepaid forward of B
C-P=F^P(A)-F^P(B) - 17Put call Parity for Currency OptionsCall - Put = exchange rate in terms of denominated currency discounted at risk free of other currency - K discounted at risk free of denominated currency.
C-P=X_0e^(-r_F(T-t))-Ke^(-r_d(T-t)) - 18What triggers a margin callWhen the Margin falls below the maintenance margin
If the maintenance margin percentage of the initial margin which is the # of contract*the price*the #units of index(multiplier) is higher than the initial margin change + the accumulated value of the initial margin. - 19Bid and ask priceBid: The price the investor sells to market makers
Ask: The price the market makers sell at - 20Reasons for inefficiency of market portfolioProxy Error: Market portfolio contains all trade able assets in economy but market proxy cannot include most of these.
Behavioral Biases: Novice investors are subject to systematic behavioral biases and hold inefficient portfolios.
Alternative Risk Preferences: Some investors focus on more than volatility choosing unlikely and extreme high payoffs
Non-trade able wealth: Investors are exposed to risk of human capital that they causing them to diversify in the market and deviate from market portfolio. - 21Usual method in Mcdonaldu/d movement is e(r-div)h+-vol*sqrt(h)
p* = 1/(1+e^vol*sqrt(h)) - 22IPO Puzzles1. On average IPOs appear to be underpriced
2. The number of IPOs are highly cyclical. There are significantly more IPOs during good economic conditions than poor economic conditions.
3. The costs of an IPO are high making it unclear why firms are willing to incur them
4. on average, the long-run performance of a newly public company is poor. - 23Properties of coherence1. Translation invariance
2. Positive Homogeneity
3. Monotonicity
4. Subadditivity
Coherent: TVAR
Not Coherent: VAR cause of subadditivity - 24Lognormal distribution properties1. Skewed Right
2. Products of lognormal random variables are lognormally distributed
3. Negative outcomes are impossible
4. In binomial dist, stock price distribution approaches lognormality as the number of steps become large. - 25Sharpe RatioRisk premium/volatility
- 26delta hedgebuy/sell options, buy sell stocks, borrow lend money: Total Delta has to be 0.
- 27delta gamma hedgebuy/sell options, total gamma must equal 0.
delta of stock is 1 all other Greeks are 0. - 28CAPM equationExpected return = risk free + Beta of stock * market risk premium
- 29WACCW_E*R_E+W_D*r_D(*1-T_C)
- 30Forward Start OptionS_t[e^(-div(T-t))N(d1)-Xe^-(r(T-t))*N(d2)
d_1 = ln(1/x) + (r-div+0.5vol^2)(T-t)/vol*sqr(T-t) - 31What does N(d2) mean?The risk neutral probability that an option on the stock will be in the money at expiration. Pr(X>K) = N(d2)
Pr(X - 32Strong Form of efficient market hypothesisStock prices reflect all information even inside past prices, public, and private
- 33Semi-strong version of efficient market hypothesisStock prices reflect past prices and public information
- 34Weak version of market efficiency hypothesisStock prices only reflect past prices
- 35Municipal bondsIssued by local and state governments
default more often than federal bonds
income not taxable at federal level
general obligation backed by full faith of local and state governments
revenue bonds pledge specific revenues generated by projects that were initially financed by the bond issue - 36Average CovarianceCorrelation*volatility1*volatility2
- 37Capital market lineRisk premium of market over volatility of market. The sharpe ratio of the market is the slope of the capital market line.
- 38How to determine if adding a stock will improve portfolioIs the sharp ratio of the current portfolio times the correlation less than the sharpe ratio of the additional portfolio.
- 39Real OptionsTiming Option(Call Options): Gives a company the option to delay making an investment with the hope of having better information in the future
Sizing Option: Growth option(company has option to make additional investments when optimistic), abandonment option(company has option to abandon project when pessimistic). - 40Systematic Trading BiasesHolding on to losers and the disposition effect
Investor attention, mood, and experience
Herd Behavior - 41Funding for Private CompaniesAngel Investors
Venture Capital Firms
Private Equity Firms
Institutional Investors
Corporate Investors\ - 42Venture Capital FirmLimited Partnership not a corporation
- 43Advantages/Disadvantages to IPOAdvantages: Greater Liquidity, Better access to capital
Disadvantages: Dispersed Equity holdings, compliance is costly and time-consuming - 44Lead Underwriter to IPOPrimary banking firm responsible for managing the deal.
- 45Domestic BondsIssued by local body bought by foreign investors
- 46Foreign BondsIssued by a foreign entity intended for local investors
- 47EurobondsInternational bonds that can be traded anywhere adn the entity which issues may be local or foreign not priced in teh country of origin's currency.
- 48Global bondsCombine features of domesic, foreign and eurobonds offered for sale in several different markets simultaneously
- 49Yankee BondsForeign bonds in the U.S. In japan these are called samurai bonds, in the U.K. Bulldogs.
- 50Corporate BondsHave maturities of 30 years or less, pay semiannual coupons, face amount denominated in standard increments most often $1,000, historically bearer bonds owner must provide explicit proof of ownership in order to receive coupon payments but today mostly registered bonds where issuer maintains list of all holders.
- 51Asset backed securitySecurity whose cash flows are backed by the cash flows of its underlying securities. Biggest sector is the mortgage backed security - home mortgages.
- 52Collaterized debt obligationA private ABS can be backed by another ABS.
- 53Identify arbitrageTwo step approach: Observe what happend, write down inequality, + is cash inflow(sell), - cash outflow(buy)
- 54What separates futures from forward1. Traded on an exchange
2. Standardized(size, expiration, underlying)
3. more liquid(can offset position by purchasing opposite position next day)
4. Marked-to-market and often settled daily
5. Minimal credit risk
6. Price limit is applicable - 55Bounds of Option PricesS>= C_American >= C_European >= max(0, F^P(S)-Ke^-rT)
K>= P_American >= P_European >= max(0, Ke^-rT- F^P(S)) - 56Bounds for European Call & PutF^P(S) >= C_Euro >= max(0, F^P(S)-Ke^-rT)
Ke^-rT >= P_Euro >= max(0, Ke^-rT- F^P(S)) - 57Bounds for American Call and PutS >= C_Amer >= max(0, S-K)
K >= P_Amer >= max(0, K-S) - 58Early Exercise of American CallNon-dividend paying stock early exercise is never optimal
Dividend Paying Stock
PV(Divs) > PV(Interest on Strike) + Put - 59Early Exercise of American PutPV(Interest on Strike) > PV(Divs) + Call
- 60Strike Price Effects (Calls)For K1 < K2 < K3,
C(k1) >= C(K2) >= C(K3)
C(K1)-C(K2) =< K2-K1
C(K1)-C(K2)/(K2-K1) >= C(K2)-C(K3)/(K3-K2) - 61Strike Price Effects (Puts)For K1 < K2 < K3,
P(k3) >= P(K2) >= P(K3)
P(K2)-P(K1) =< K2-K1
P(K2)-P(K1)/(K2-K1) =< P(K3)-C(K2)/(K3-K2) - 62Replicating PortfolioAn option can be replicated by buying delta shares of the underlying stock and lending B at the risk free rate.
- 63Finding Delta (R.P.) and B(R.P.)Delta = E^)-(div yield)h)*(Value_up-Value_down)/(Stock(u-d))
Delta = E^(-rh)*(u*Value_down-d*Value_up)/(u-d) - 64Value of Option (R.P.)V= Delta*Stock + B
- 65Risk Neutral ValuationThe probability of an upward move
p* = e^((r-div yield)h)-d/(u-d) - 66Valuation of Option (Binomial Trees)V_0 = e^(-rh)*E*[Payoff] = e^(-rh)*[(p*)*V_u + (1-p*)V_d]
bonus: S_0e^((r-d)h) = (p*)S_u + (1+p*)S_d - 67Lognormal Model for stock pricesln[S_T/S-t] ~ N[m,v^2]
m=(alpha-div yield - .5*(volatility^2))(T-t)
v^2=Volatility^2(T-t) - 68Expected Price of Stock in lognormal E[S_t]S_t*e^((alpha-div yield)(T-t))
- 69Var[S_t](E[S_t]^2*e^((v^2)-1)
- 70Finding Percentiles with lognormalS_T = S_t*e^[(alpha-div yield-0.5*volatility^2)(T-t)+volatility*(T-t)^(1/2)*Z_value)]
- 71Greeks: DeltaCall = e^((-div yield)*(T-t))*N(d1), 0 =< Delta =< 1
Put = e^((-div yield)*(T-t))*N(-d1), -1 =< Delta =< 0
Delta_c-Delta_p = e^-div yield(T-t) - 72Greeks: GammaGamma_c =Gamma_p = (e^(-div yield*(T-t))N'(d1))/(S*volatility*(T-t)^(1/2))
- 73Greeks: ThetaTheta_C = div yield*Stock*exp(-div yield*(T-t))*N(d1)-rK*exp(-r(T-t))*N(d2)-(Kexp(-r(T-t))*N'(d2)*volatility)/(2(T-t)^(1/2)
Theta_p = Theta_c + rK*exp(-r(T-t)) - div yield*Stock*exp(-div yield*(t-t)) - 74N'(x)exp(-x^2)/(2pi)^(1/2)
- 75Delta Gamma Theta approximationV_t+h = V_t + delta_t*(S_t+h-S_t)+.5*gamma_t(S_t+h-S_t)^2+Theta_t*h
- 76SEC FilingsThe SEC(Securities and exchange commission) requires companies to prepare a registration statement that provides its financials and other information to investors prior to an IPO.
The red herring circulates to investors before the stock is offered.
Final prospectus: includes details of the IPO such as the quantity of shares available and the offer price. - 77Standard Lookback optionStrike is the minimum value of the stock over its lifetime-floating strike
- 78Extrema Lookback callStock value used is the maximum of its value over the lifetime of the option-fixed strike
- 79Gap OptionK1:Strike Price
K2:Trigger Price
K1 determines amount of the nonzero payoff. K2 determines whether the option will have a nonzero payoff. Negative payoffs are possible. d1 and d2 are based on K2 in black scholes. - 80Exchange OptionCall: Give up the strike in exchange for underlying asset
Put: Give up underlying asset in exchange for the strike asset. - 81Diversifiable riskDoes not affect the premium of a security. Investors will not pay for something they can do themselves.
- 82Variance of equally weighted portfolio1/n*avgVar + (1-1/n)*AvgCov
- 83Non-systematic behavioral biasesUnderdiversification: Familiarity bias, relative wealth concerns
Excessive Trading: Overconfidence, sensation seeking. - 84cost of carryrisk free rate minus dividend yield
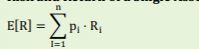
- 85Expected Return of a Single Asset
- 86Variance and stdev of a single asset
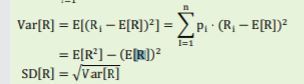
- 87Realized Return of an asset: 1. Realized 2. Annual Realized
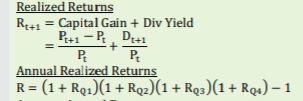
- 88Annual: 1. Average Return 2. Variance of Return 3. Standard Error of Returns 4. 95% confidence interval of expected return
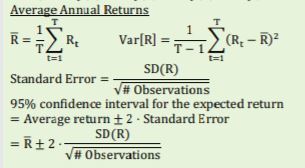
- 89Expected return of a portfolio
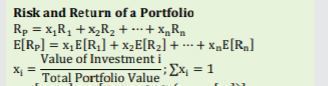
- 90Covariance between two stocks
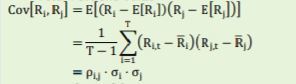
- 91Two stock portfolio: 1. Return of portfolio 2. Variance of portfolio
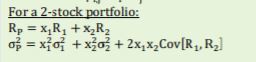
- 92Three Stock portfolio 1. Return of portfolio 2. Variance of portfolio
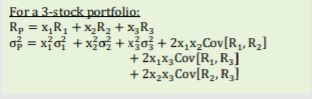
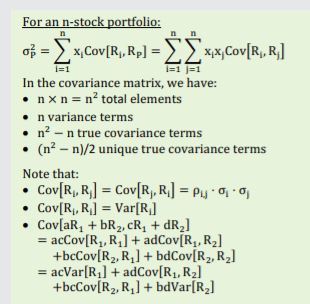
- 93N Stock Portfolio 1. Return of portfolio 2. Variance of portfolio1. weighted average among stocks
2.
- 94Systematic RiskKnown as common, market, or non-diversifiable risk. Fluctuations in a stock's return that are due to market-wide news.
- 95Nonsystematic riskAlso known as firm-specific, independent, idiosyncratic, unique, or diversifiable risk. Fluctuations in a stock's return that are due to firm-specific news.
- 96Total RiskSystematic Risk + Unsystematic Risk
- 97DiversificationReduces a portfolio's total risk by averaging out nonsystematic fluctuations
- 98Why won't investors pay for nonsystematic fluctuationsInvestors can eliminate nonsystematic risk for free by diversifying their portfolios. Thus the risk premium for no systematic risk is zero.
- 99What is risk premium determined by?The risk premium of a security is determined by its systematic risk and does not depend on its nonsystematic risk.
- 100Variance equally weighted(last 3 might apply to all portoflios) portfolio: 1. n-stock portfolio 2. Very large portfolio 3. Independent Stocks 4. Large and independent
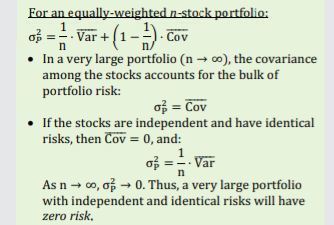
- 101Volatility# of stocks graph 1. Where is diversification effect most significant 2. Why cannot we no eliminate all risk
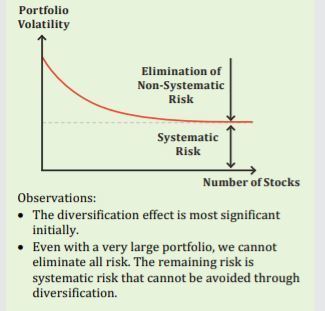
- 102How much does each security contribute to the portfolio volatility?
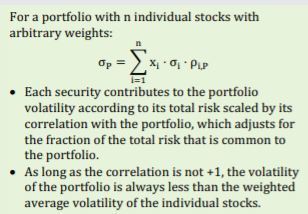
- 1034 assumptions of mean variance portfolio theory1. All investors are risk averse
2. The expected returns, variances, and covariances of all assets are known.
3. To determine optimal portfolios, investors only need to know the expected returns, variances and covariances of returns.
4. There are no transactions costs or taxes. - 104What makes an efficient portfolio?A portfolio is efficient if the portfolio offers the highest level of expected return for a given level of volatility(or the lowest level of volatility for a given level of return).
- 105Efficient Frontier
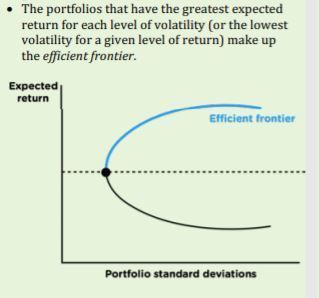
- 106The effect of correlation: 1. row = 1 2. row <1 3. row = -1
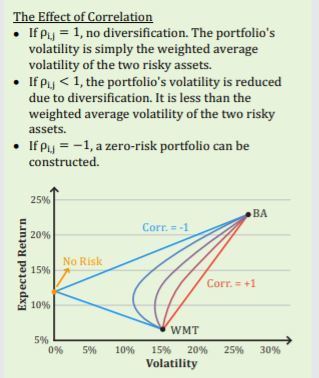
- 107Capital Allocation Line
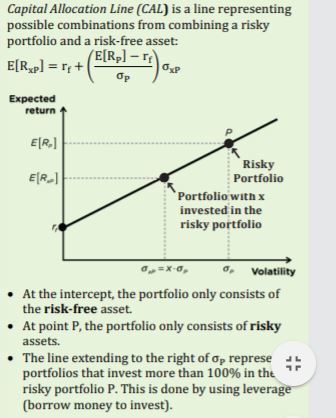
- 108Expected return on asset + risk free asset
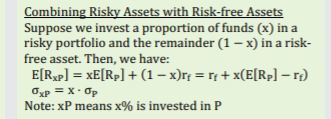
- 1094 aspects of the Tangent Portfolio1. The risky portfolio on the efficient frontier of risky assets that is tangent to the CAL
2. It is the optimal risky portfolio that will be selected by a rational investor regardless of risk preference
3. The Sharpe Ratio for a tangent portfolio will always be the highest, so the tangent portfolio is efficient
4. All combinations of the risk free asset and the tangent portfolio are efficient portfolios. - 110When it is optimal to add an investment to a portfolio
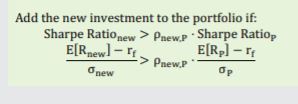
- 1113 steps to creating Capital Market Line
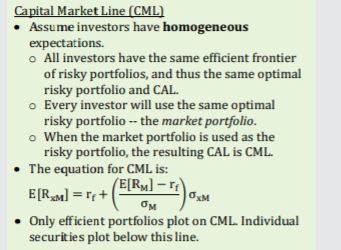
- 1123 aspects of homogeneous expectations
- 113Rank the 5 asset classes by expected return1. Small-Cap(market cap in bottom 20% of NYSE) 12.83%
2. Large-cap stocks(S&P 500 Index) 9.99%
3. World-Portfolio(International) stocks 8.83%
4. Corporate Bonds(AAA-Rated, avg. 20 yr. term) 3.45%
5. Treasury bills (one-month return) 2.93% - 114Rank the 5 asset classes by Volatility1. International Stocks 12.83%
2. Small-cap stocks 9.99%
3. Large-cap stocks 8.83%
4. Treasury bills 3.45%
5. AAA-rated corporate bonds 2.93% - 115Cov(x+y,z+w)cov(x,z)+cov(x,w)+cov(y,z)+cov(y,w)
- 116What do Perfectly Correlated Portfolios have in commonHave the same sharpe ratio. There y-intercept is the risk free rate
- 117Beta: DefinitionThe expected percent change in an asset's return given a 1% change in the market return.
- 1184 Key facts about Beta1. Measures the sensitivity of the asset's return to the market return
2. The beta for a stock on average is around 1
3. Cylical industries(tech, luxury, goods) tend to have higher betas.
4. Non-cyclical industries (utility, pharmaceutical) tend to have lower betas. - 119Cyclical IndustryTypes of industries which are more sensitive to economic shocks for example technology and luxury goods. Thus cyclical industries tend to have higher betas
- 120Non-cyclical industriesexample: utility and pharmaceutical industries tend to have lower betas. These industries are more stable and highly regulated and thus are less sensitive to fluctuations in the overall market.
- 121Interpreting Beta: 1. Beta = 1 2. Beta > 1 3. Beta < 1 4. Beta = 01. The asset has the same systematic risk as the market. The asset will tend to go up and down the same percentage as the market.
3. The asset has more systematic risk than the market. The asset will tend to go up and down more than the market on a percentage basis
4. The asset has less systematic risk than the market. The asset will tend to go up and down less than the market on a percentage basis.
5. The asset's return is uncorrelated with the market return. - 122Equation for Beta for an asset and beta for a portfolio and beta estimation
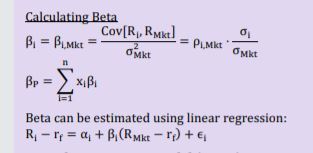
- 123CAPM Equation
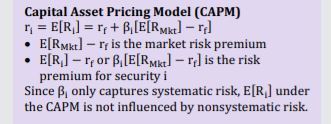
- 1243 Assumption of CAPM1. Investors can buy and sell all securities at competitive market prices. There are no taxes or transaction costs. Investors can borrow and lend at the risk-free rate
2. Investors hold only efficient portfolios of traded securities
3. Investors have homogeneous expectations regarding the volatilities, correlations, and expected returns of securities.
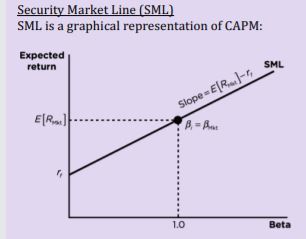
These assumptions lead to the fact that the market portfolio is the efficient portfolio. - 125Security Market Line(SML): Definition
- 126CML vs SML 1. Type of Risk 2. Securities Held
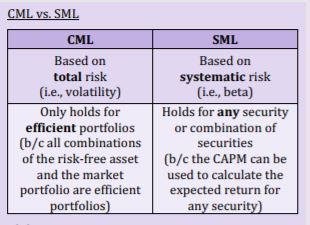
- 127AlphaThe difference between a security's expected return and the required return(as predicted by the CAPM)
- 128Alpha Equation

- 129SML Key factor about efficiencyIf the market portfolio is efficient than all securities are on the SML: the expected return equals the retired return and alpha is 0.
If the market portfolio is not efficient than all securities will not all lie on the SML and the expected return does not equal the required return and alpha is not equal to 0. - 130How to improve the market portfolio1. Buy stocks whose expected return is above the required return.
2. Sell stocks whose expected return is less than the required return. - 131Two methods to estimate the market risk premium1. Historical Risk Premium - Uses the historical average excess return of the market over the risk-free interest rate
2. Fundamental Approach - Uses the constant expected growth model to estimate the market portfolio's expected return - 132Fundamental Approach Equation

- 133Two methods to estimated debt cost of capital

- 134Required Return on a Project

- 135Weighted Average Cost of Capital

- 136Capital Market Line and Sharpe RatioAll points on the CML have the same sharpe ratio
- 137Estimating BetaLinear Regression through calculating the line of best fit for the stock's excess return versus the market's excess return
Information
- Description
- Mathematics Flashcards on Exam Flash Cards, created by Russell Harmening on 20/09/2018.
- Created by
- Russell Harmening
- Views
- 39
- Rating