
Flashcards
Confidence Intervals and Normal Distribution Recap
Cards in this deck (28)
- 1Some continuous random variables can be modelled using....Normal distribution
- 2The graph of a population that's normally distributed has what shape?A bell-shaped curve
- 3This normal distribution graph is symmetrical about....The mean (μ)
- 4In normal distribution, the mean is also equal to.....The median and the mode
- 5The area under the curve of a normal distribution graph is used to calculate....The probability (entire area = 1)
- 6The spread of the population is measured by....Standard deviation (σ)
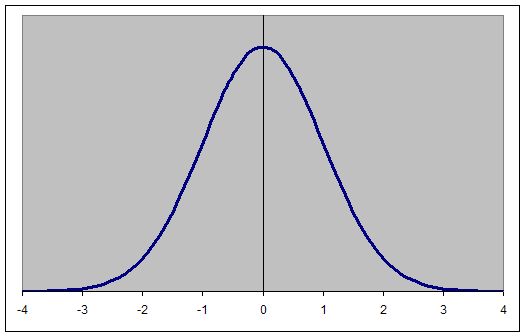
- 7Normal distribution graph: (note: this is standard normal, so mean = 0 and s.d = 1) (both sides of mean = 50%)
- 8We write the random variable for normal distribution as:X ~ N (μ , σ^2)
So for s.d, we need to square root the variance (root(σ^2)) - 9Approximately, what percentage of the population lies within 1 standard deviation, σ, about the mean? (μ - σ , μ + σ)68%
(34% each side of the mean) - 10Approximately, what percentage of the population lies within 2 standard deviations about the mean? (μ - 2σ , μ + 2σ)95%
(47.5% each side of the mean) - 11Approximately, what percentage of the population lies within 3 standard deviations about the mean? (μ - 3σ , μ + 3σ)99.7%
(49.85% each side of the mean) - 12What is the difference between x̄ and μ ?x̄ = sample mean
μ = population mean - 13What is a confidence interval?A region bounded between 2 numbers that you are confident, to a certain level, that the population mean, μ, lies within
- 14How do we write the confidence interval if the parent mean is an equal distance between a and b?(a,b)
- 15What is the distribution for the standard normal?Z ~ N (0.1)
- 16What is the z-score?A measure of how many standard deviations a value is away from the mean
- 17How would we find the z-score for a 90% confidence interval?Do 100-90 = 10 , 10/2 = 5 , the 90+5 = 95%
(if it was 80% then z-score = 90%)
Convert 95% to 0.95 (decimal) , then use inverse normal function on calculator and set area to 0.95 , s.d = 1 and mean = 0 - 18What is the formula to find the confidence interval?(x̄ - z(σ/root(n)) , x̄ + z(σ/root(n)))
Where n = sample size , x̄ = sample mean , σ = s.d , z = z-score - 19What does σ/root(n) represent?Standard error
(s.d for distribution of the sample means) - 20(x̄ - z(σ/root(n)) , x̄ + z(σ/root(n))) means we are....."y %" confident our population mean lies between these values
- 21If the population is normally distributed and variance is unknown, we get a value for varience by.....Calculating it from the sample
- 22When calculating variance from the sample, what needs to be true?n≥30 , as the sample size needs to be large
- 23How do we calculate the biased estimator of population variance? (from sample with n≥30)Σx^2/n - x̄^2
- 24Using the biased estimator, how do we calculate the unbiased estimator?Unbiased = (n/n-1) x biased
s^2 = (n/n-1)(Σx^2/n - x̄^2)
(this can also be done on calculator,
1-variable) - 25The sample MEAN is always an....Unbiased estimator of population mean
- 26For confidence intervals when variance is unknown, use:(x̄ - z(s/root(n)) , x̄ + z(s/root(n)))
- 27If category A has a confidence interval of (170,184), and category B has a confidence interval (163,173), which has a higher mean?There is no evidence to prove either has a higher mean, as both overlap and both could have a mean of 172
- 28For the confidence interval (79,87) what could we estimate the sample mean to be?87-79 = 8 , 8/2 = 4 , so 79+4 = 83 (sample mean = 83)
Information
- Description
- Confidence Intervals and Normal Distribution Recap
- Created by
- Doc Boff
- Views
- 5
- Rating