2482712
Description
Flashcards by Beth Strain, updated more than 1 year ago
More

|
Created by Asterisked
over 10 years ago
|
|
|
|
Copied by Beth Strain
over 10 years ago
|
|
| Question | Answer |
| MEASURES OF CENTRAL TENDENCY Mean (Statistical Average) | PROS: Takes all scores into account CONS: Can be distorted by extreme scores |
| MEASURES OF CENTRAL TENDENCY Median (Middle Value) | PROS: Unaffected by extreme scores = gives a representative value CONS: Less sensitive = doesn't take all values into account |
| MEASURES OF CENTRAL TENDENCY Mode (Most Frequent) | PROS: Useful in categorical data (e.g - no of babies securely attached) CONS: Not useful to describe data when there are several modes |
| MEASURE OF DISPERSION Range (Smallest score taken away from the Largest) | PROS: Easy to calculate CONS: Range can be distorted by extreme scores |
| MEASURE OF DISPERSION Standard Deviation (Measure of dispersion that indicates the spread of data around a central value) | PROS: Takes account of all scores; Sensitive measure of dispersion CONS: More difficult to calculate compared to range |
| MEASURE OF DISPERSION Standard Deviation Types | Large S.D - A lot of variation around the mean Small S.D - Data 'closely clustered' around the mean Zero S.D - All data values were the same |
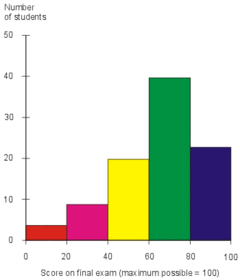
| Histogram | Continuous Scale: Bars are joined together and are of identical width Commonly used to show scores (e.g - tests) |
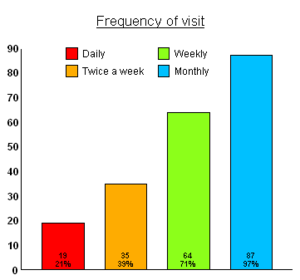
| Bar Chart | Has one data series = simple Can represent frequencies of single statistics (e.g - mean of a sample) Discontinuous (aren't joined together) Likely to be used when comparing groups of data. |
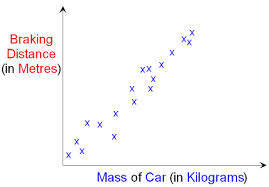
| Scattergram | Used to show strength and relationship of correlations Can be either positive, negative, or without correlation The correlation is determined with a line of best fit. (+0.99 = STRONG POSITIVE -0.64 = STRONG NEGATIVE) |
| Content Analysis (Converts qualitative data into quantitative) | 1) Sampling 2) Creation of Coding System 3) Pilot Study Conducted 4) Conduct the Analysis 5) Make into quantitative display 6) Check reliability (compare results) |
| Content Analysis (Pros & Cons) | PROS: Very simple and relatively quick method of the analysis of qualitative data CONS: Can be interpreted differently by different researchers |
| Pure Qualitative Analysis | Data is transcribed Data is read through repeatedly to detect recurrent themes All data read and re-read until all emerging themes have been identified (that account for all data collected) |
Want to create your own Flashcards for free with GoConqr? Learn more.