
Flashcards
Distributions
Cards in this deck (46)
- 1Distributions Why do we need this?To describe/analyse data in an appropriate way
• To exclude human perception of the data
• Assess differences in samples of populations
– Assess the probability of these populations either
being the same (“null hypothesis”), or being different
(“Alternate hypothesis”)
• As in life, there is no certainty resulting from statistical tests, only chance or probability. - 2What is ‘Probability’?How frequently we
expect different
outcomes to occur if we
repeat the experiment
over and over… - 3Definitions - variable There are two main types of data or variables:• Qualitative/categorical variables is data that is not given numerically
e.g. gender, place of birth, type of car etc.
• Quantitative data is numerical and are two types:
1. Discrete data – which can only take specific numeric values;
e.g. shoe size, number of brothers, number of cars
2. Continuous data – can take any numerical values;
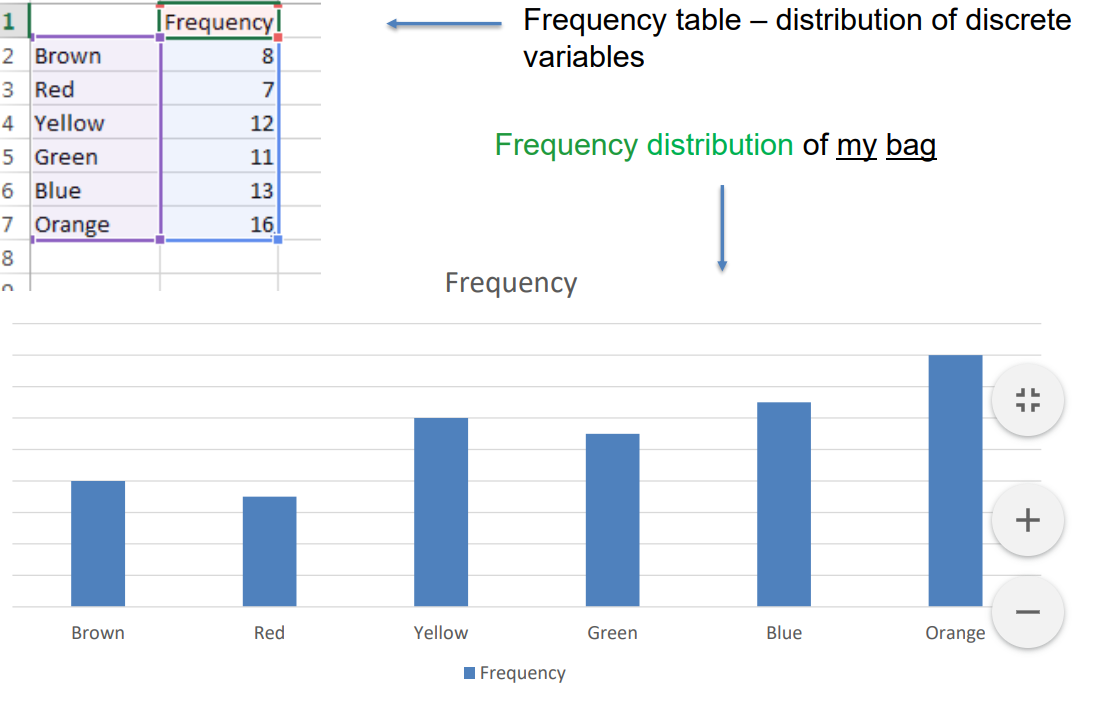
e.g. height, mass, length, time etc. - 4Let look at discreate data and a frequency distribution
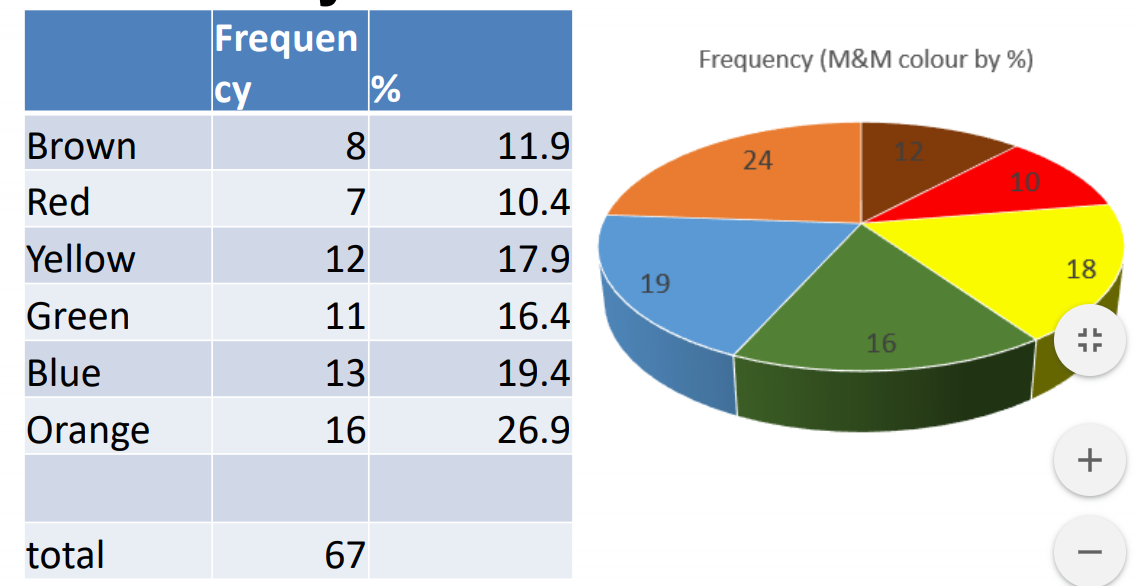
- 5Probability distribution
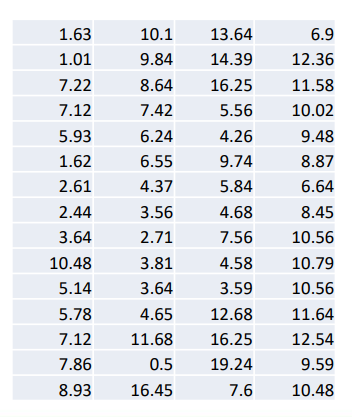
- 6What about continuous variables?Time for Lecturer A to respond to emails (in
hours and minutes):
Problem: time to respond is a continuous
variable and not two times will be the same!
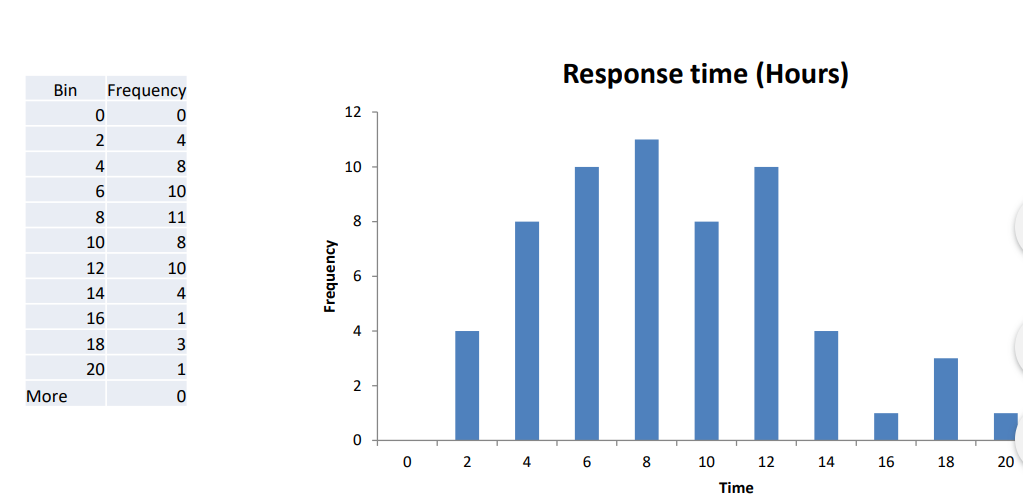
A ‘frequency distribution’ will be useless as we would have 50 odd times each with a
frequency of 1.
The solution to this problem is a ‘grouped frequency distribution’ - 7What about continuous variable Time for Lecturer A to respond to emails (in hours and minutes):
- 8Continuous variables – grouped frequency distribution
- 9Examining a DistributionCentral tendency is measured in three ways:
– mean, median and mode.
• Mean - average score of a distribution.
• Median is the centre, or middle score within a distribution.
• Mode is the most frequent score within a distribution. - 10Measures of Central Tendency Number of mobile numbers on students’ mobile phones Student # of Numbers
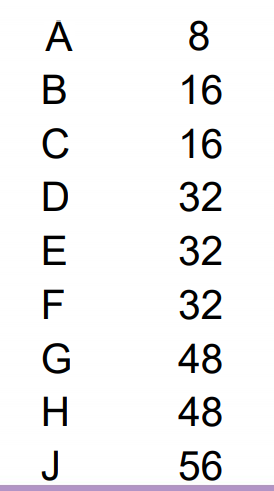
- 11Calculating mean, median and mode
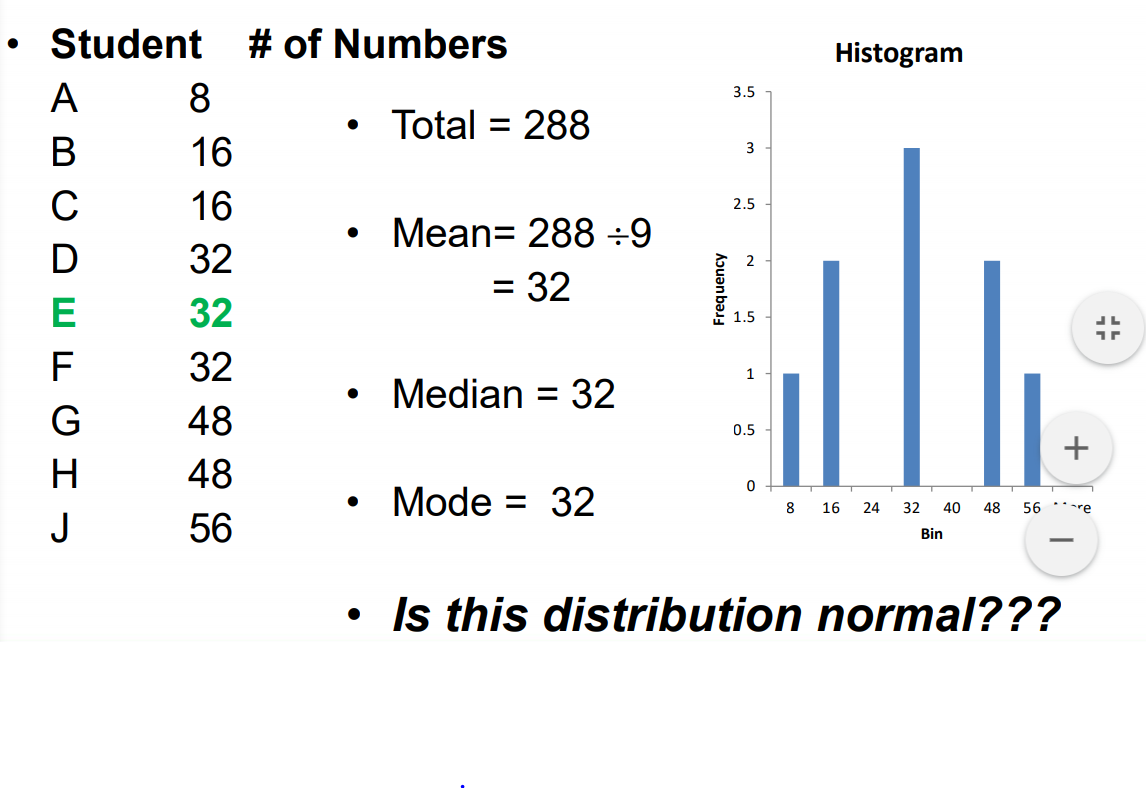
- 12—yes
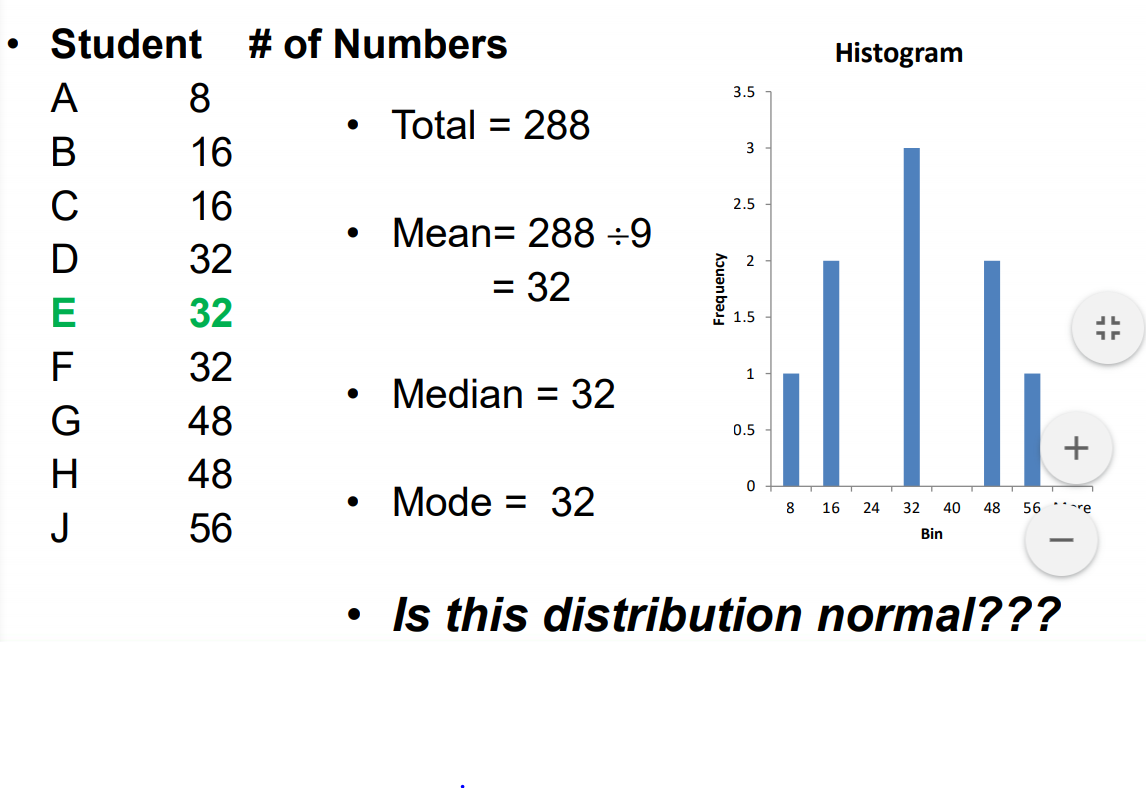
- 13In a normal distributionMean= median=mode
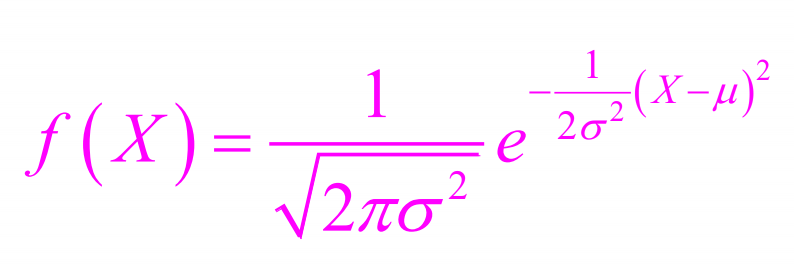
- 14The Gaussian (aka ‘normal’) distribution• Distributions for continuous variables are called continuous distributions (probability densities)
• Some probability densities have particular importance in statistics. A very important one is shaped like a bell, and
called the normal distribution
• Many naturally-occurring phenomena can be approximated surprisingly well by this distribution - 15The ‘normal distribution’The area under the curve equals 1
• The probability of any exact value
of X is 0
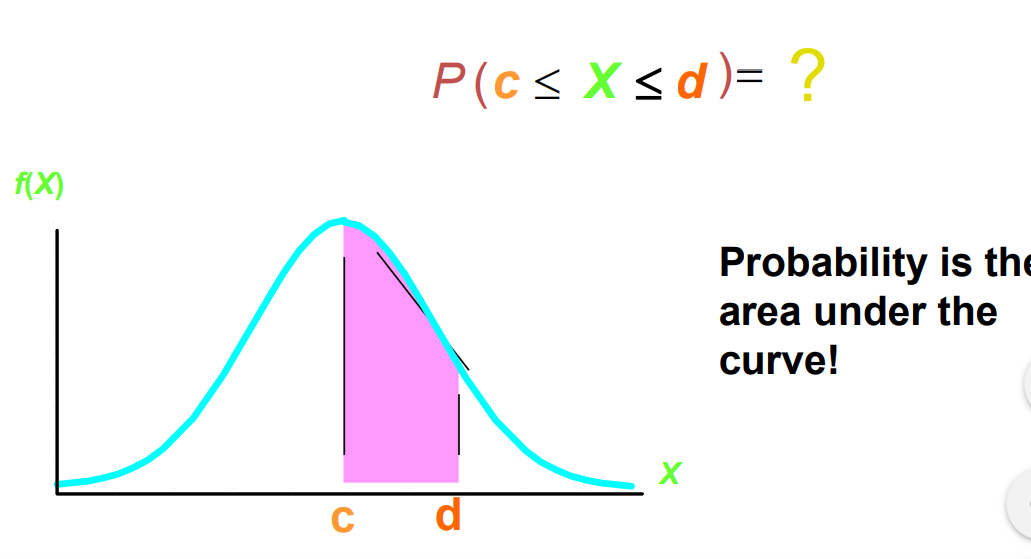
• The area under the curve between
two given points on the X-axis is
the probability that a number
chosen at random will fall between
the two points
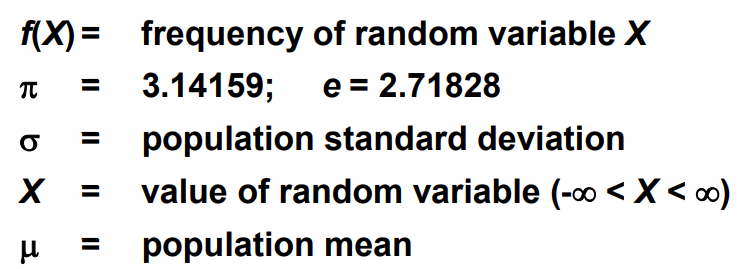
Varying the Parameters σ and μ, we obtain
Different Normal Distributions. - 16The Mathematical Model
- 17The Mathematical Model
- 18Finding ProbabilitiesP(c ≤ X ≤ d ) = ?
Probability is the
area under the
curve! - 19Finding Probabilities
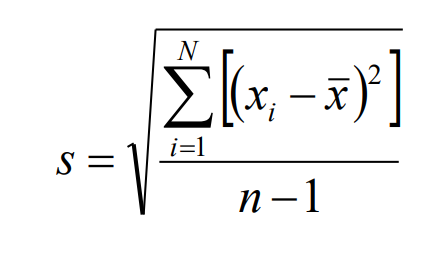
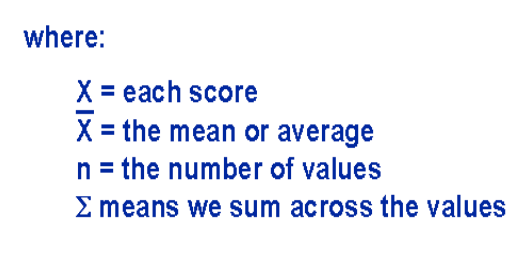
- 20What is the Standard Deviation?Standard Deviation is a measure of variability or scatter around a mean
- 21What is the Standard Deviation?
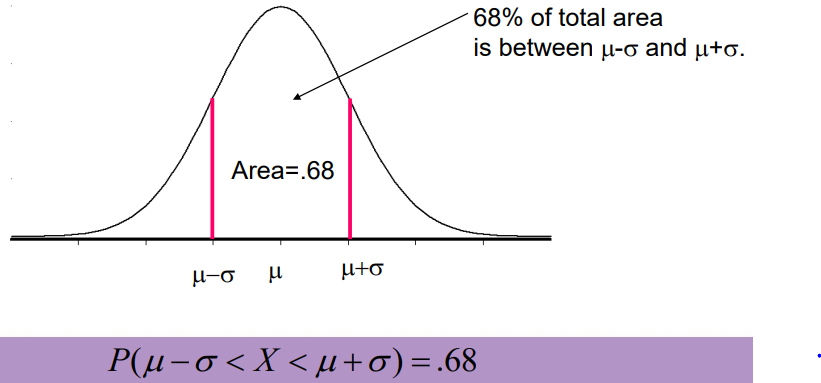
- 22Normal DistributionA symmetric distribution defined on the range -∞to + ∞ whose shape is
defined by two parameters, the mean, denoted σ, that centers the
distribution, and the standard deviation, , that determines the spread
of the distribution. - 23Normal Distribution
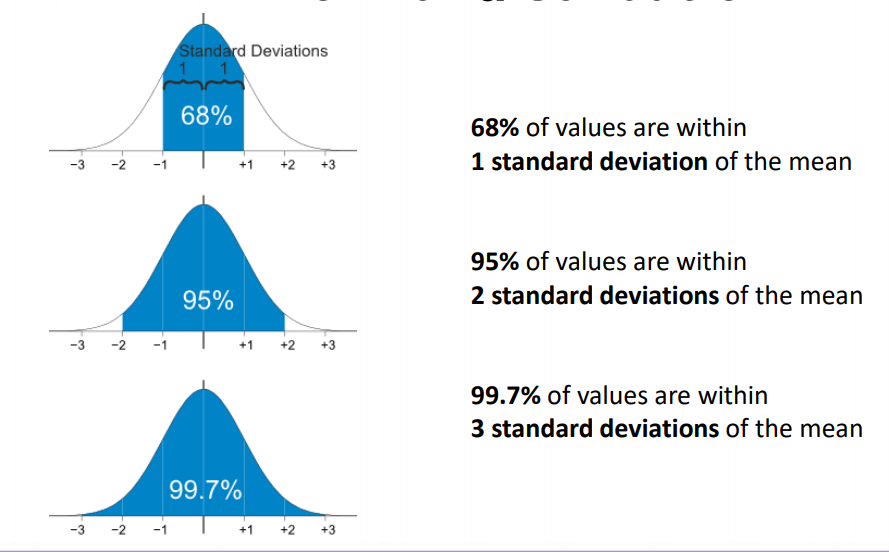
- 24Standard deviations – spread of data Normal distribution
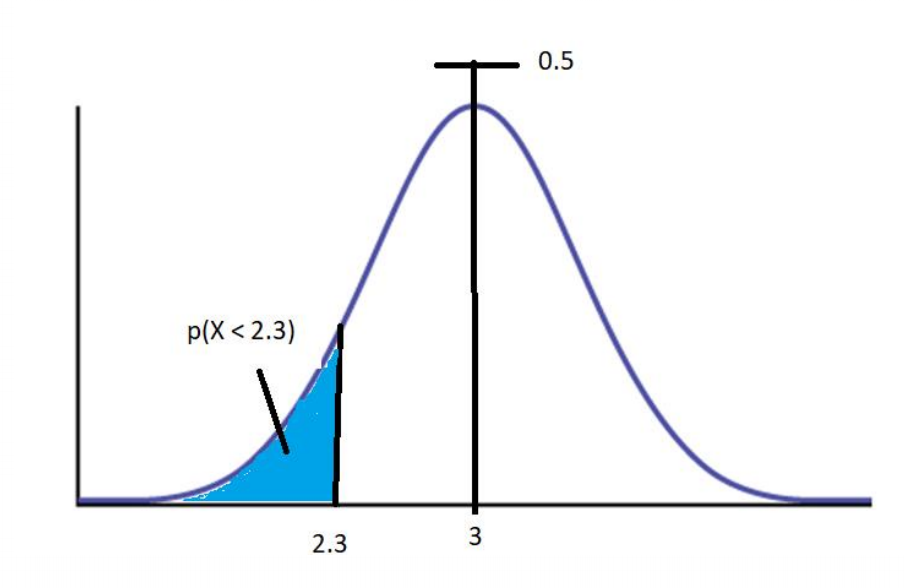
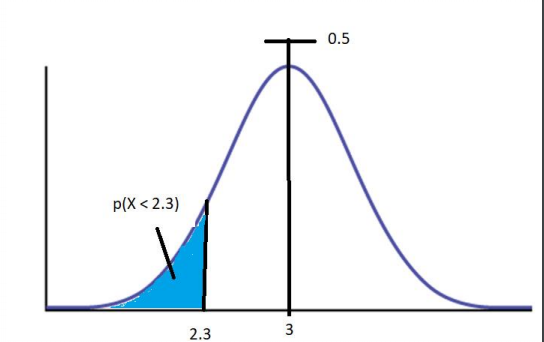
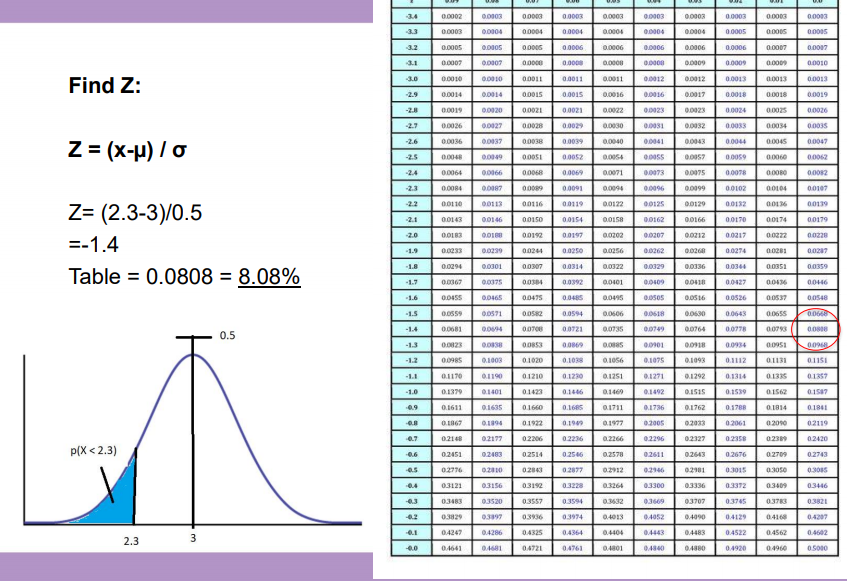
- 25Application of the normal distribution – example 1A certain type of storages battery lasts, on average, 3.0 years, with a standard derivation of 0.5 year.
Assuming that the battery lives are normally distributed, find the probability that a given battery will last LESS than 2.3 years - 26Application of the normal distribution – example 1
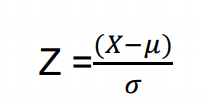
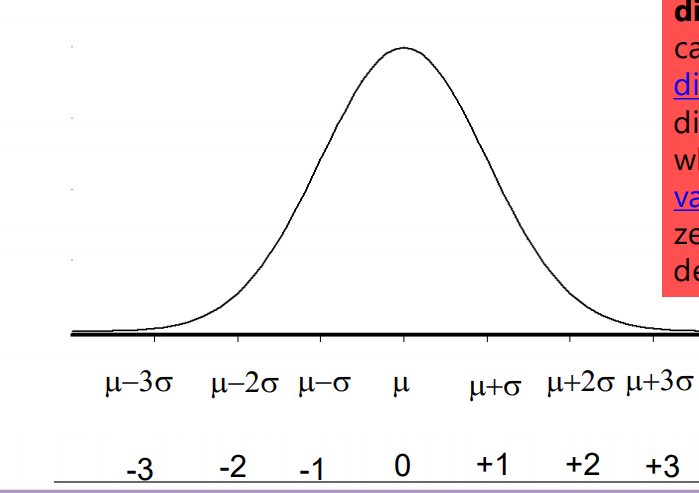
- 27Standardized normal variableIt would be difficult and tedious to do the calculus every time we had a new set of parameters for µ and σ. So instead, we usually work with the standardized normal distribution, where µ = 0 and σ = 1
The normal random variable of a standard normal
distribution is called a standard score or a z-score. Every
normal random variable X can be transformed into a z score via the following equation: - 28Standardized normal variable Every normal random variable X can be transformed into a z score via the following equation:
- 29Standard Normal Distributionthe standard normal distribution is a special case of the normal
distribution. It is the distribution that occurs when a normal random
variable has a mean of zero and a standard
deviation of one. - 30Standard Normal Distribution
- 31Application of the normal distribution – example 1A certain type of storages battery lasts, on average, 3.0 years, with a standard derivation of 0.5 year. Assuming that the battery lives are normally distributed, find the probability that a given battery will last LESS than 2.3 years
- 32Application of the normal distribution – example 1
- 33Application of the normal distribution – example 1
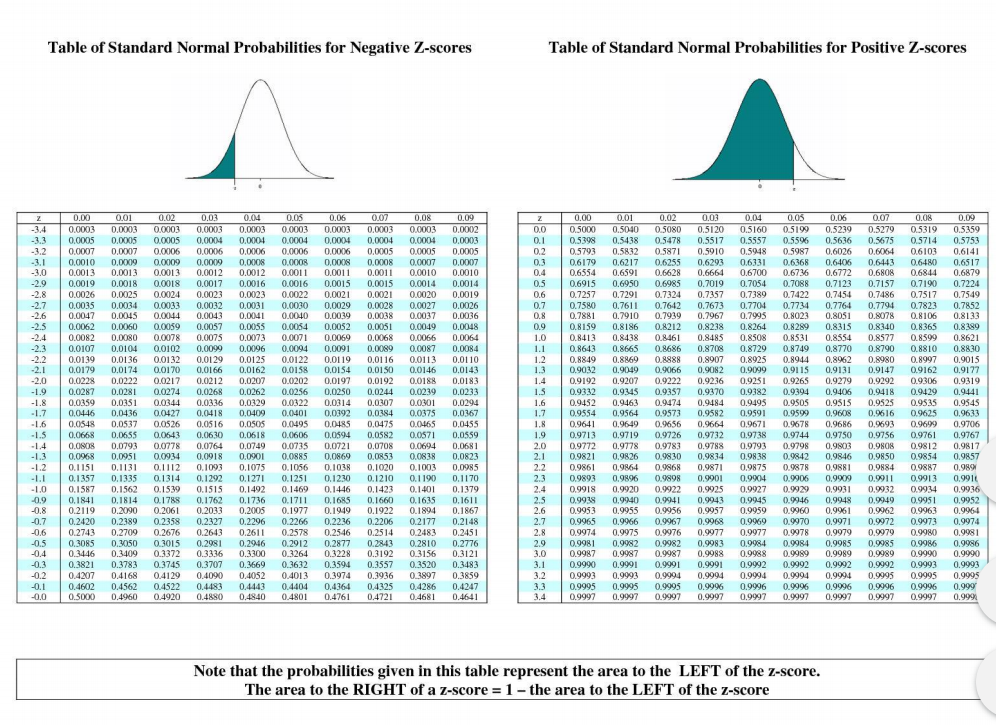
- 34table of standard probabilities
- 35Application of the normal distribution – example 3The averages life expectancy in UK is 81
years old with a standard derivation of 10
years. Assuming that life expectancy is
normally distributed, find the probability
that you will live above 90 year old? - 36Application of the normal distribution – example 3The average mark for the BIOT1004 module is 75 marks with a standard derivation of 14.2. Assuming that the mark distribution is normally distributed, find the probability that a student will get a mark between 50-60?
- 37Application of the normal distribution – example 3
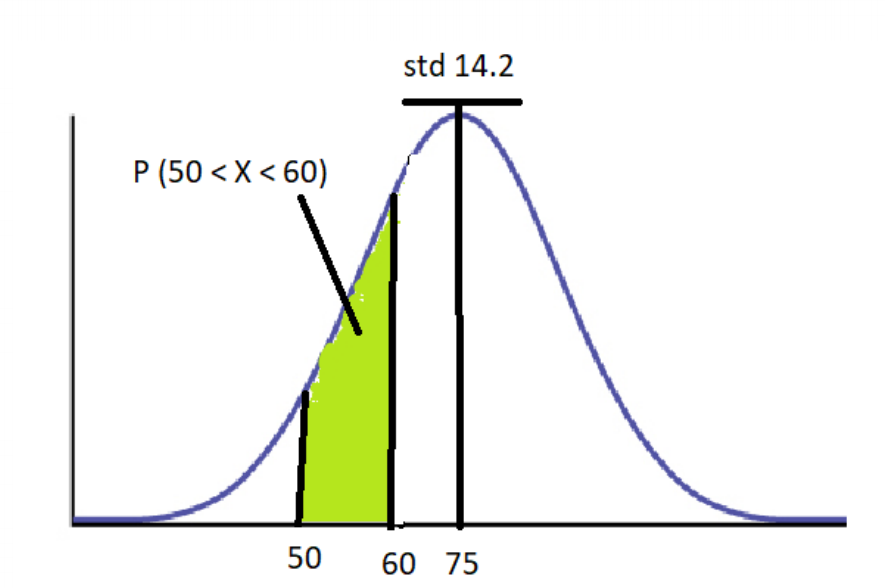
- 38Anytime that you are performing a statistical analysis (t-test, ANOVA and many more), you need tomake sure that you are working
with normally distributed data, or your
analysis will probably not be valid - 39back to the example ‘response time’ Is this distribution ‘normal’?
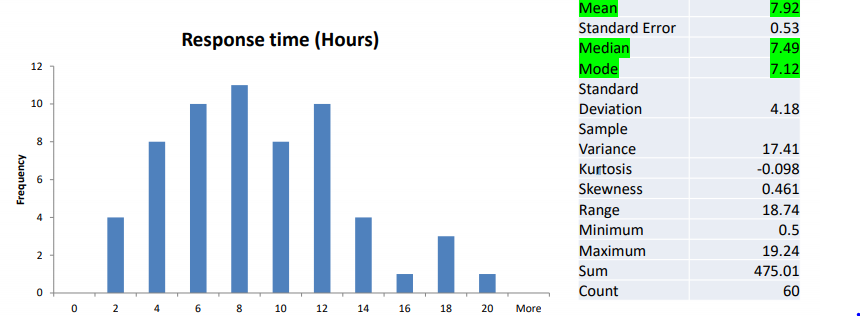
- 40Skewness negatively skewed
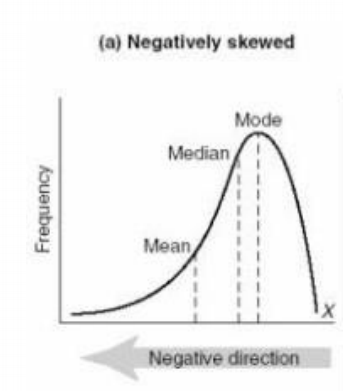
- 41Skewness normal (no skew)
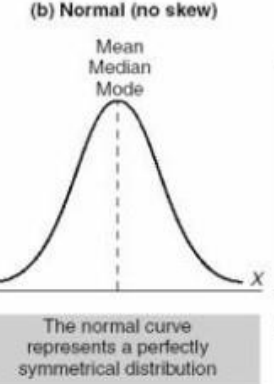
- 42Skewness positively skewed
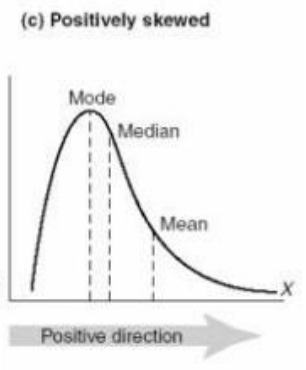
- 43Looking at symmetry Skewnessthe level of non-symmetry. A
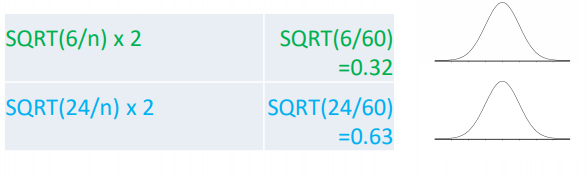
symmetric dataset got a skewness of 0 - 44Looking at symmetry Kurtosisa measure of the combined
weight of the tails relative to the rest of
the distribution’. Normally distributed data got a value of 0 - 45Looking at symmetry
- 46—
Information
- Description
- Flashcards on Distributions, created by megan trent on 06/10/2020.
- Created by
- megan trent
- Views
- 0
- Rating