Bar graphs

Description

School supplies represented on a bar graph.
disha Manchanda
Flashcards by disha Manchanda, updated more than 1 year ago More Less
disha Manchanda
Created by disha Manchanda almost 4 years ago
disha Manchanda
Copied by disha Manchanda almost 4 years ago
1
0
1 2 3 4 5 (0)

Resource summary

Question Answer
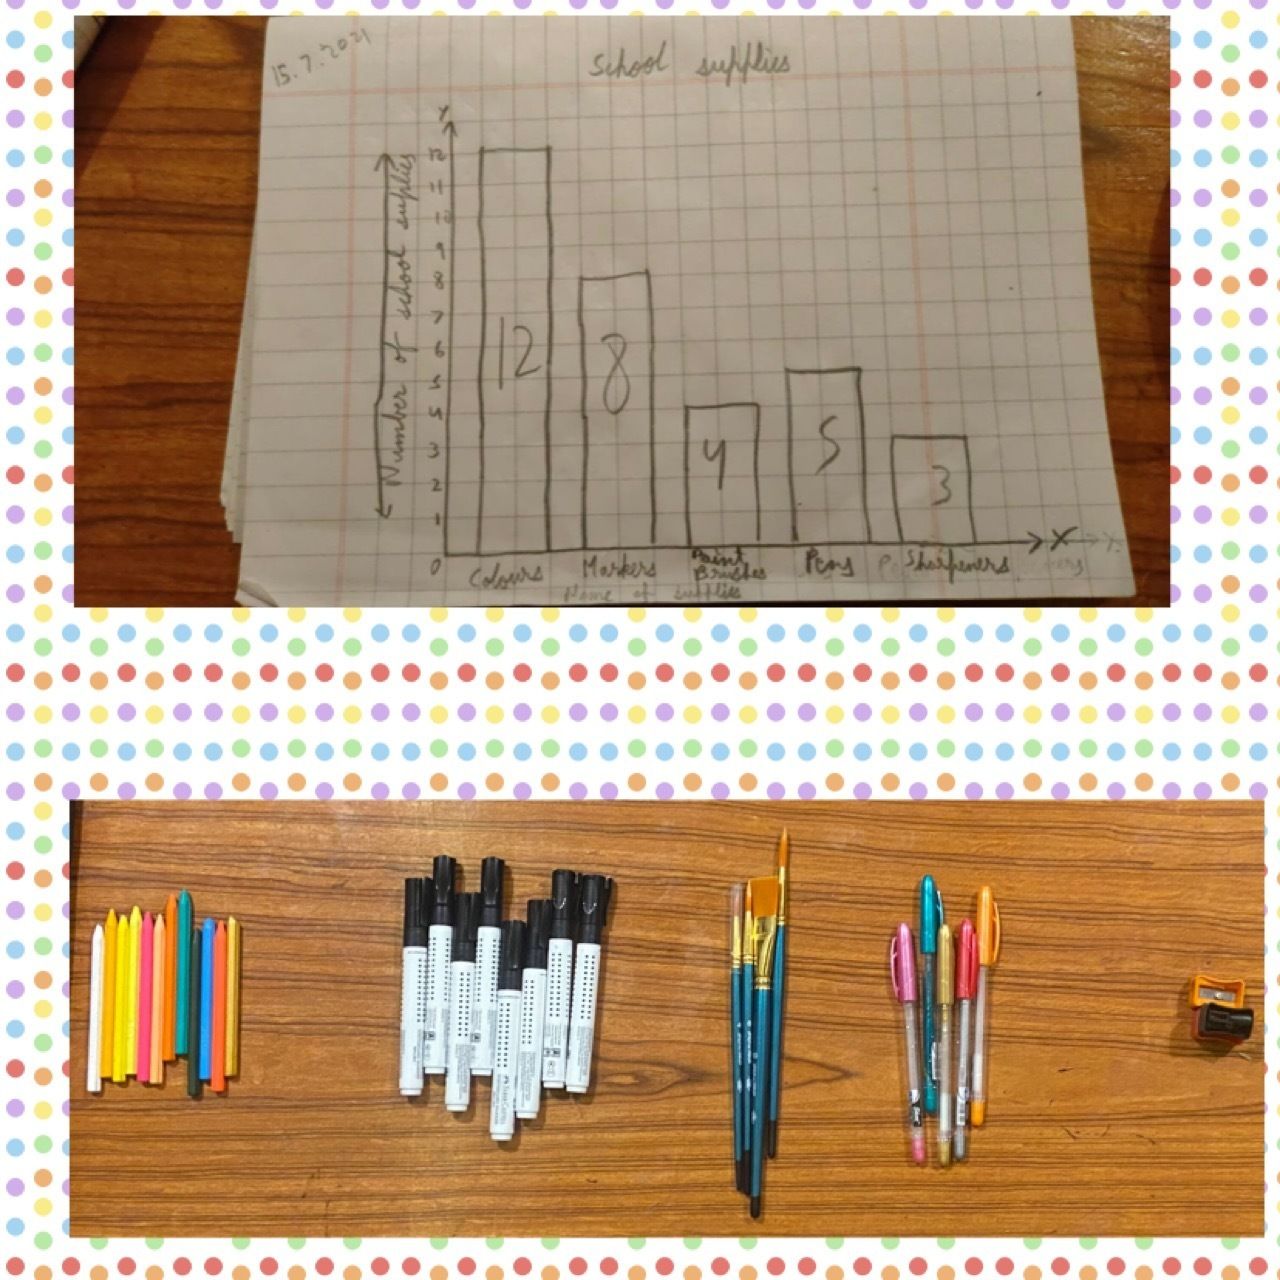
This bar-graph shows the number of school supplies on the table. The height of the bars shows the number of supplies in each category.
Show full summary Hide full summary

0 comments

There are no comments, be the first and leave one below:

Similar

Maths
xcathyx99
Maths Revision
Asmaa Ali
AS level geography- Geographical Skills
beth2384
General Notes for Imperfect Competition
Ashley Hay
Line graph description
Jessica Viviana Toledo
C2 4.1 How Fast?
Meredith Fletcher
velocity-time graphs
ILMDB
Macro Economics 1
ching__e
AS Level Physics Lesson 5 Uniformly Accelerated Motion Quiz #2
Jeffrey Piggott
Maths Preparation
gareth.mallinson