4385636
Description
Flashcards by Rachael Jones, updated more than 1 year ago
|
|
Created by Rachael Jones
about 10 years ago
|
|
| Question | Answer |
| (dependent variables) define: nominal, ordinal, interval, ratio. | Nominal- categorical (type of beer). Ordinal- relative position (rank of beer). Interval- difference between 2 values meaningful(mean temp of beer). Ratio- similar interval w/ meaningful zero point(beers per night). |
| Define within-subjects and between-subjects designs. | Within subjects(repeated measures), group experience both conditions. Between-subjects, 2 groups experience one condition. |
| 3 measures of central tendency | Mean. Mode and Mediun. |
| Define standard deviation and variance? (And why?) | *variance = sum of squares / number of items *standard deviation brings variance back to original measures (not squared :P) *Variance = (Std Deviation)^2 *the deviation of individual samples can be positive or negative, by simply adding them together they would cancel each-other out, by squaring the std deviation it truly represents the total variance. |
| Normal Distribution | A function the represents the distribution of many random variables as a symmetrical bell-shaped graph. |
| What is a Gaussian equation? | An equation to find the height of the distribution at any point: |
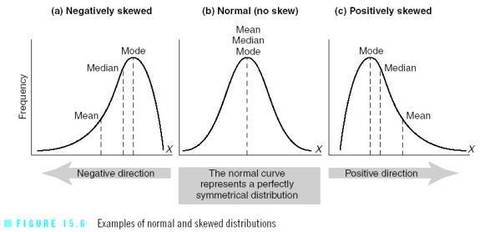
| Define a positive-skew, negative-skew (and un-skewed) | |
| What are Z-scores? (and how are they calculated?) | They tell us how many standard deviations are above/below the mean value. *calculated by taking the observation, subtracting it from the mean of all observations, and dividing the result by the standard deviation of all observations. *by converting a distribution of observations into Z-scores a new distribution is created that has a mean of 0, and a standard deviation of 1. |
| How to determine sampling error. | if you take a random sample from population of values to estimate parameters of original population. BUT the mean of each sample will differ from the true mean of the population. |
| Standard Error of the Mean (SEM) - also called the 'confidence interval' | essentially a measure of how confident we are that we know the true population mean, this is dependent on: variability of original data, number data used to create sample mean. -standard deviation squared (negative results become positive) -tells you the RANGE of values the mean might really take. |
| standard deviation vs SEM | stdev=the amount that scores vary. SEM=measure of confidence we know true population mean. |
| An easy example to explain degrees of freedom? | if we keep alternating males + females around a table then (N-2) can choose their own seat. |
| Define 'co-variance' | How much 2 random variables change TOGETHER. If the 2 variables show very similar patterns the co-variance value will be positive, if they are very different the value is negative . |
| Explain Spearman's rs | A (Non-parametric) bivariate correlation coefficient (uses ORDINAL data) that relates to Pearsons Rho, first work out the ranking of the data then perform pearson's Rho(r^2) on the rank scores. *ranking the data reduces the impact of outliers |
| Partial Correlations? | sometimes a correlation between 2 variables might only be explained by another variable e.g. does excessive drinking affect the brain during exams? -correlate how many times one gets drunk(A) with exam score (B) -what about the fact that the drinking stopped one from being at home studying? (C) |
| Correlation terminology: -Partialled out? -Zero order correlation -first-order corr -second-order corr | -Variable C is referred to as being 'partialled out'/held constant -A simple correlation is also called a zero-order correlation. -first order has one variable held constant -second order has two variables held constant |
| What is 'power'? | - the ability of a test to detect an effect, it can be used to determine how big a sample is required to detect a significant effect. P= the probability of finding an effect given that one truly exists. (Ho is false) denoted by 1-'Beta' |
| What does the Bonferroni correction do? | divides the alpha value by the number of statistical comparisons made to see how many tests will give false results. |
| What to do if there are low assumptions for data in a chi-square test? | 'collapse categories' and include smaller categories within other categories- or discard a small category and run the test on the remaining data. |
| What is a 'binomial test '? | used for data that can only have 2 values, compares whether frequency of occurrence for 2 values has some expected ratio e.g. whether a coin is giving heads suspiciously often or within the range expected by chance. |
| What does an ANOVA do? | *compares multiple groups (as using multiple t-tests would require an abnormally low alpha) *compares the amount of variance explained by the experiment with variance that is unexplained. |
| For an ANOVA what is 'F'? | F is the explained variance divided by the unexplained variance |
| A repeated measures ANOVA? | parametric test that establishes the differences between multiple groups in a repeated measures design |
| What is regression analysis? | a technique to fit a model (mathematical equation) to data, can be a very simple or complex (few or many parameters). Simplest non-trivial model is the linear model (y=a+bx) (equation of a line). **Once the equation has been fitted to the data the slope of the relationship between 2 variables becomes clear and it is much easier to predict y given x etc. |
| regression analysis versus correlations? | -correlations show that there is a relationship between the variables and how much noise contributes -regression analysis tells us what the relationship is but does NOT tell us whether it is real. |
| Define Non-Parametric tests | where the data is not required to fit a normal distribution- this (usually) uses ordinal data so does not rely on numbers, but rather a ranking or order of sorts. -parametric= preferred because more 'power' |
| What do resampling techniques do? | measure sampling error by repeating the sampling process a large number of times. This can determine the likely error introduced by sampling by looking at the variability in the resampling. |
| Between-subject randomisation tests (aka permutation tests) | want to determine the likelihood of getting differences this extreme if the data all came from a single population. Simulate running the experiment many times, with data all coming from 1 population to check what range is normal. Keep measured values but SHUFFLE them (randomly assign them to 2 groups)- count how often the difference between the new means is bigger than between the measured means. Assume they are real and sensible values (do not assume anything about distribution). |
| Within-subjects randomisation test | in each group resample the values and shuffle for each subject rather than across the whole data set (randomise the sign of the difference for each pair) |
| Bootstrap resamples | can be used to calculate: confidence interval of a mean or SEM etc. Can also determine whether some test values are inside or outside the 95% confidence interval (is a non-parametric method so makes very few assumptions of the data). |
| A one-sample test (resampling stats) | we can simply count how often a mean occurs within the bootstraps, order the data find how many values are </> the mean. |
| Jack knife method (resampling stats) | similar to bootstrap but rather than 'randomly sampling with replacement', resampling is done by 'selecting all data but one'. |
| Monte-carlo method (resampling stats) | create data based on model stimulations & compare these to real data.. |
| Perentile bootstrap confidence interval | order bootstrap samples and trim the top and bottom 2.5% to create 95% confidence- see where the data lies. |
| Describe error-bar plots | indicate the variability or confidence interval for a data point. Should be added whenever you display a mean of several measurements. Std-dev, SEM or CIS can all be used to make the error bars. |
| Describe a Kruskal-Wallis test | Non-parametric test that establishes the differences between multiple groups with one independent variable in an independent measures design. |
| Describe Wilcoxen signed-rank test | a non-parametric test that establishes the differences between 2 conditions that are experienced by 1 group. |
| Describe a Friedman's ANOVA | Non-parametric test that establishes the differences between multiple groups in a repeated measures design. |
| What does a significant test statistic tell you? | that there is an effect in the population of sufficient magnitude to be scientifically interesting. |
| Define Platykurtic and Leptokurtic distributions | -Platykurtic distributions are shorter and flatter -Leptokurtic distributions are taller and 'peakier' |
| Type 1 error definition and relation between power & alpha | falsely accepting the exp hypothesis (false alarm) probability = alpha (probability that this occurred by chance is 0.05, probability of data must be less than alpha...) |
| In SPSS what is the correct way to record non-numerical values? | to define the variable as "string". |
| What does a Chi-Square test do? | compares the frequencies observed in certain categories to the frequencies you might expect to get in those categories by chance using a contingency table. |
| Describe a Chi-square good-ness of fit test | uses one categorical variable from a single population |
| Describe a Pearson's Chi-square test | EXAMPLE: - you are asking adults which fizzy drink they prefer: Pepsi or Sprite, and comparing the answers given by each gender. |
| Describe an independent samples t-test | parametric test that establishes whether two means collected from independent samples differ significantly. |
| Describe a related-sample t-test | parametric test that establishes the differences between 2 conditions that are experienced by 1 group. |
| Describe a One-way ANOVA: | Parametric test that establishes the differences between multiple groups with one independent variable in an independent measures design. |
| Describe a factorial ANOVA | a test that establishes the differences between multiple groups using multiple independent variables. |
| What are post-hoc tests? | set of comparisons between group means that were not thought of before data were collected. Typically involve comparing the means of all combinations of pairs of groups. *less power than planned contrasts & are usually for exploratory work for which no firm hypotheses were available on which to base planned contrasts. |
| What is a residual? | The difference between the observed value of the dependent variable and the predicted value |
| Describe heteroscedasticity and homoscedasticity | - hetero= circumstance in which the variability of a variable is unequal across the range of values of a second variable that predicts it. - homo= circumstance in which the variability of a variable is equal across the range of values of a second variable that predicts it. |
| What does a test of homoscedasticity of error terms determine? | whether a regression model's ability to predict a DV is consistent across all values of the DV. |
| what does an assumption of homogeneity and heterogeneity of variance mean? | *same as tests of homo/hetero-scedasticity but for an ANOVA. |
| Describe Levene's test: | a test of homogeneity for multiple groups (with independent ANOVA). A significant result implies that the variances are DIFFERENT. *when sample sizes are large, small differences in group variances can produce a significant Levene’s test. |
| Describe the assumption of sphericity | the assumption of equal variance between multiple variables and multiple groups (ANOVA) |
| What is standardisation? | the process of converting a variable into a standard unit of measurement. The unit of measurement typically used is 'standard deviation unit' (z-scores). *allows us to compare data when different units of measurement have been used. |
| How much variance is explained by a correlation? (e.g. 0.9) | the percentage of variance that is explained is equal to the square of the correlation coefficient (e.g. 0.81) |
| Why mustn't the expected values of a chi-square fall below 5(ish)? | if the individual values are low the category totals are likely to overlap. *need a more specific/sensitive test. |
| Supposedly how should you compensate for heterogeneity of variance in an independent samples t-test? | by correcting the degrees of freedom. |
| in a factorial design with 2 factors, if the effect of one factor appears to depend on the levels of the second factor this is called: | an interaction effect. |
| an experiment was conducted in which participants were given lists to learn in either quiet or noisy environments. Later, recall was either in the same or a different context of learning. What design is this experiment? | Two factorial (2 IV factors) fully independent measures (both are between-subjects). |
| In linear regression the variable that is being predicted (y) is called: | *dependent variable *criterion variable |
| How to calculate the Total Error/Sum of Squares | *Square the deviations of the mean (result-mean) and add them together, need to square them so positive + negative don't just cancel each other out! *divide by number of items=Variance! |
| How to calculate the expected frequency off of a contingency table: *for example frequency of men that prefer sport (both genders and several favourite tv shows) | (number of men/total people) X (number of people that like sport/Total) XX the Total |
| Define: *Mean Square *Distribution-free-tests *B/b (not Beta) | *a sum of squares divided by its degrees of freedom. *Non-parametric tests! *the gradient of the regression line and the strength of the relationship between a predictor and the outcome variable. |
| What is the non-parametric equivalent of the Bonferroni post-hoc tests? | The Games-Howell post-hoc tests. *'no variances assumed' |
Want to create your own Flashcards for free with GoConqr? Learn more.