7638678
Description

Flashcards by Assged Abdalla, updated more than 1 year ago
|
|
Created by Assged Abdalla
almost 9 years ago
|
|
| Question | Answer |
| Why are measurements and observations displayed in tables? | When they are displayed in tables they are more understandable and easier to read. |
| What can Spreadsheets be programmed to do? | Spreadsheets can automatically calculate values ; averages . |
| Define the word discrete from discrete groupings? | Discrete groupings are observations that can be sorted into definite categories and counted. |
| Define the word continuous? | Measurements involving numbers aren't discrete but continuous. This means that if you choose two numbers you can always find other numbers in between. |
| What are some examples of continuous measurements? | Examples of continuous measurements include age, mass, length, volume, temperature and human height. |
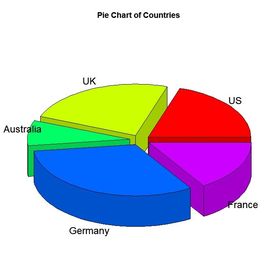
| Discrete groupings can construct different types of graphs name them. | Discrete groupings can only construct pie or sector graphs. |
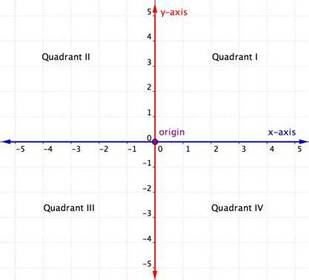
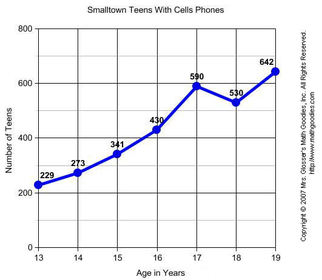
| Line graphs require two sets of measurements that show continuous variation. What are they? | The two sets of measurements are the horizontal and vertical axes. |
| What's the difference between line graphs and lines of best fit? | Line graphs connect trough different points and lines of best fit go roughly through all the points. |
| What do Scientists need to do during an experiment to make it useful? | Scientists need to a scientific report to explain how they ran the experiment, what they measured and how they interpreted the results. |
| How do tables and graphs help scientists when they do their experiments? | Tables and graphs help scientists display patterns in their measurements. |
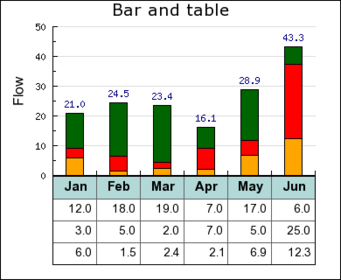
| What types of graphs are used when you have a set of discrete observations? | Bar and column graphs show discrete values . |
| What is shown in a pie or sector graph? | A pie or sector graph shows proportions of each grouping within an total. The whole pie or sector graph represents 100%. |
| What are the different types of line graphs? | Line of best fit and curve of best fit. |
| What can a graph do that table cannot? | A graph can show trends more clearly than tables can. |
| What makes an experiment complete? | An experiment will be complete when using some way or another you communicate with other scientists. |
| What computer program can enable you produce a digital table or a spreadsheet? | A spreadsheet can enable you to produce computer programs such as Microsoft and excel e.t.c.. |
| Apart from enabling computer programs what else can a spreadsheet do? | A spreadsheet can also use scientist's measurements to construct different types of graphs. |
| When discrete groups are categorized are measurements possible between each of the categories? | No measurements are possible between each of the categories. |
| Bar and column graphs have discrete values, but what is displayed from the graphs? | The discrete values display the horizontal and vertical axes on the graphs. |
| Once you have plotted all the points on a line graph there are two ways to connect the points. What are they? | They two ways are curve of best fit and line of best fit. |
Want to create your own Flashcards for free with GoConqr? Learn more.