
Mind map
Birmingham Fieldwork
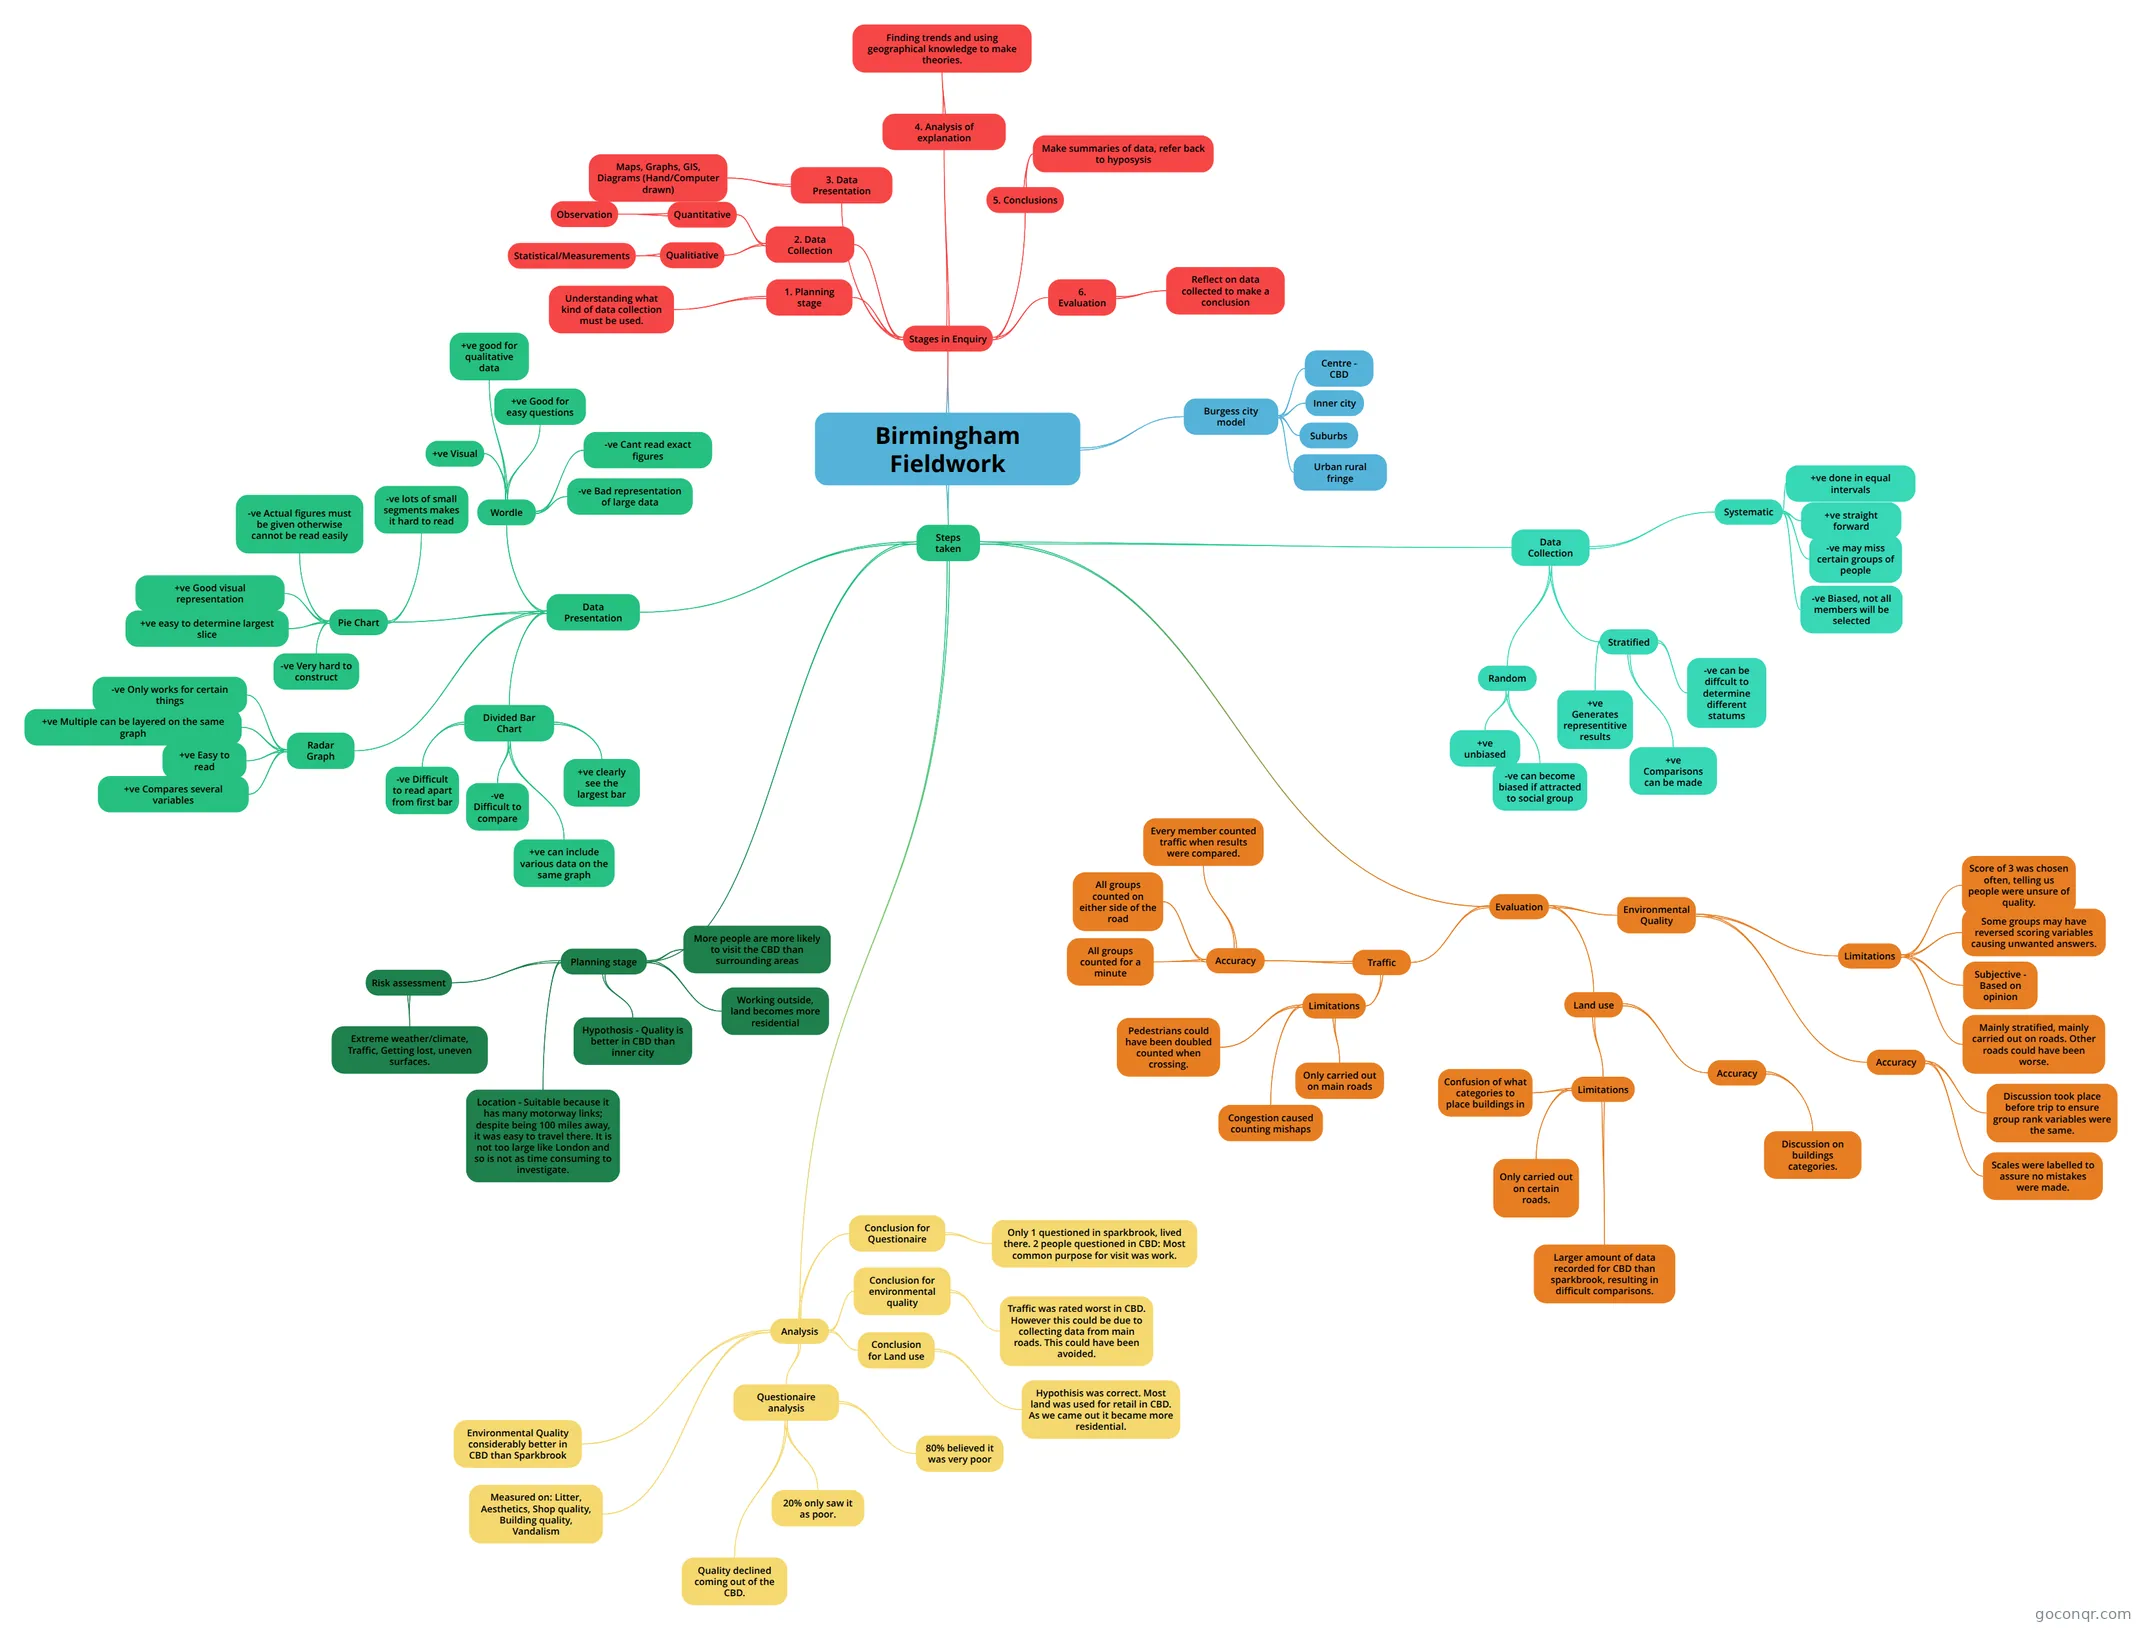
Mind map: Birmingham fieldwork
Map content
Birmingham Fieldwork
Stages in Enquiry
- 1. Planning stage
- Understanding what kind of data collection must be used.
- 2. Data Collection
- Qualitiative
- Statistical/Measurements
- Quantitative
- Observation
- Qualitiative
- 3. Data Presentation
- Maps, Graphs, GIS, Diagrams (Hand/Computer drawn)
- 4. Analysis of explanation
- Finding trends and using geographical knowledge to make theories.
- 5. Conclusions
- Make summaries of data, refer back to hyposysis
- 6. Evaluation
- Reflect on data collected to make a conclusion
- 1. Planning stage
Burgess city model
- Centre - CBD
- Inner city
- Suburbs
- Urban rural fringe
Steps taken
- Planning stage
- Hypothosis - Quality is better in CBD than inner city
- Working outside, land becomes more residential
- More people are more likely to visit the CBD than surrounding areas
- Location - Suitable because it has many motorway links; despite being 100 miles away, it was easy to travel there. It is not too large like London and so is not as time consuming to investigate.
- Risk assessment
- Extreme weather/climate, Traffic, Getting lost, uneven surfaces.
- Data Collection
- Random
- +ve unbiased
- -ve can become biased if attracted to social group
- Stratified
- +ve Generates representitive results
- +ve Comparisons can be made
- -ve can be diffcult to determine different statums
- Systematic
- +ve done in equal intervals
- +ve straight forward
- -ve may miss certain groups of people
- -ve Biased, not all members will be selected
- Random
- Data Presentation
- Radar Graph
- +ve Easy to read
- +ve Multiple can be layered on the same graph
- +ve Compares several variables
- -ve Only works for certain things
- Divided Bar Chart
- -ve Difficult to read apart from first bar
- -ve Difficult to compare
- +ve clearly see the largest bar
- +ve can include various data on the same graph
- Pie Chart
- +ve easy to determine largest slice
- +ve Good visual representation
- -ve Actual figures must be given otherwise cannot be read easily
- -ve lots of small segments makes it hard to read
- -ve Very hard to construct
- Wordle
- +ve Visual
- +ve Good for easy questions
- +ve good for qualitative data
- -ve Cant read exact figures
- -ve Bad representation of large data
- Radar Graph
- Analysis
- Environmental Quality considerably better in CBD than Sparkbrook
- Measured on: Litter, Aesthetics, Shop quality, Building quality, Vandalism
- Questionaire analysis
- Quality declined coming out of the CBD.
- 80% believed it was very poor
- 20% only saw it as poor.
- Conclusion for environmental quality
- Traffic was rated worst in CBD. However this could be due to collecting data from main roads. This could have been avoided.
- Conclusion for Land use
- Hypothisis was correct. Most land was used for retail in CBD. As we came out it became more residential.
- Conclusion for Questionaire
- Only 1 questioned in sparkbrook, lived there. 2 people questioned in CBD: Most common purpose for visit was work.
- Evaluation
- Environmental Quality
- Limitations
- Mainly stratified, mainly carried out on roads. Other roads could have been worse.
- Subjective - Based on opinion
- Some groups may have reversed scoring variables causing unwanted answers.
- Score of 3 was chosen often, telling us people were unsure of quality.
- Accuracy
- Scales were labelled to assure no mistakes were made.
- Discussion took place before trip to ensure group rank variables were the same.
- Limitations
- Land use
- Limitations
- Confusion of what categories to place buildings in
- Only carried out on certain roads.
- Larger amount of data recorded for CBD than sparkbrook, resulting in difficult comparisons.
- Accuracy
- Discussion on buildings categories.
- Limitations
- Traffic
- Limitations
- Only carried out on main roads
- Congestion caused counting mishaps
- Pedestrians could have been doubled counted when crossing.
- Accuracy
- All groups counted for a minute
- All groups counted on either side of the road
- Every member counted traffic when results were compared.
- Limitations
- Environmental Quality
- Planning stage
Information
- Description
- GCSE Geography Mind Map on Birmingham Fieldwork, created by Parth Shetty on 08/06/2018.
- Created by
- Parth Shetty
- Views
- 31
- Tags
- Rating