
Mind map
Economic Growth
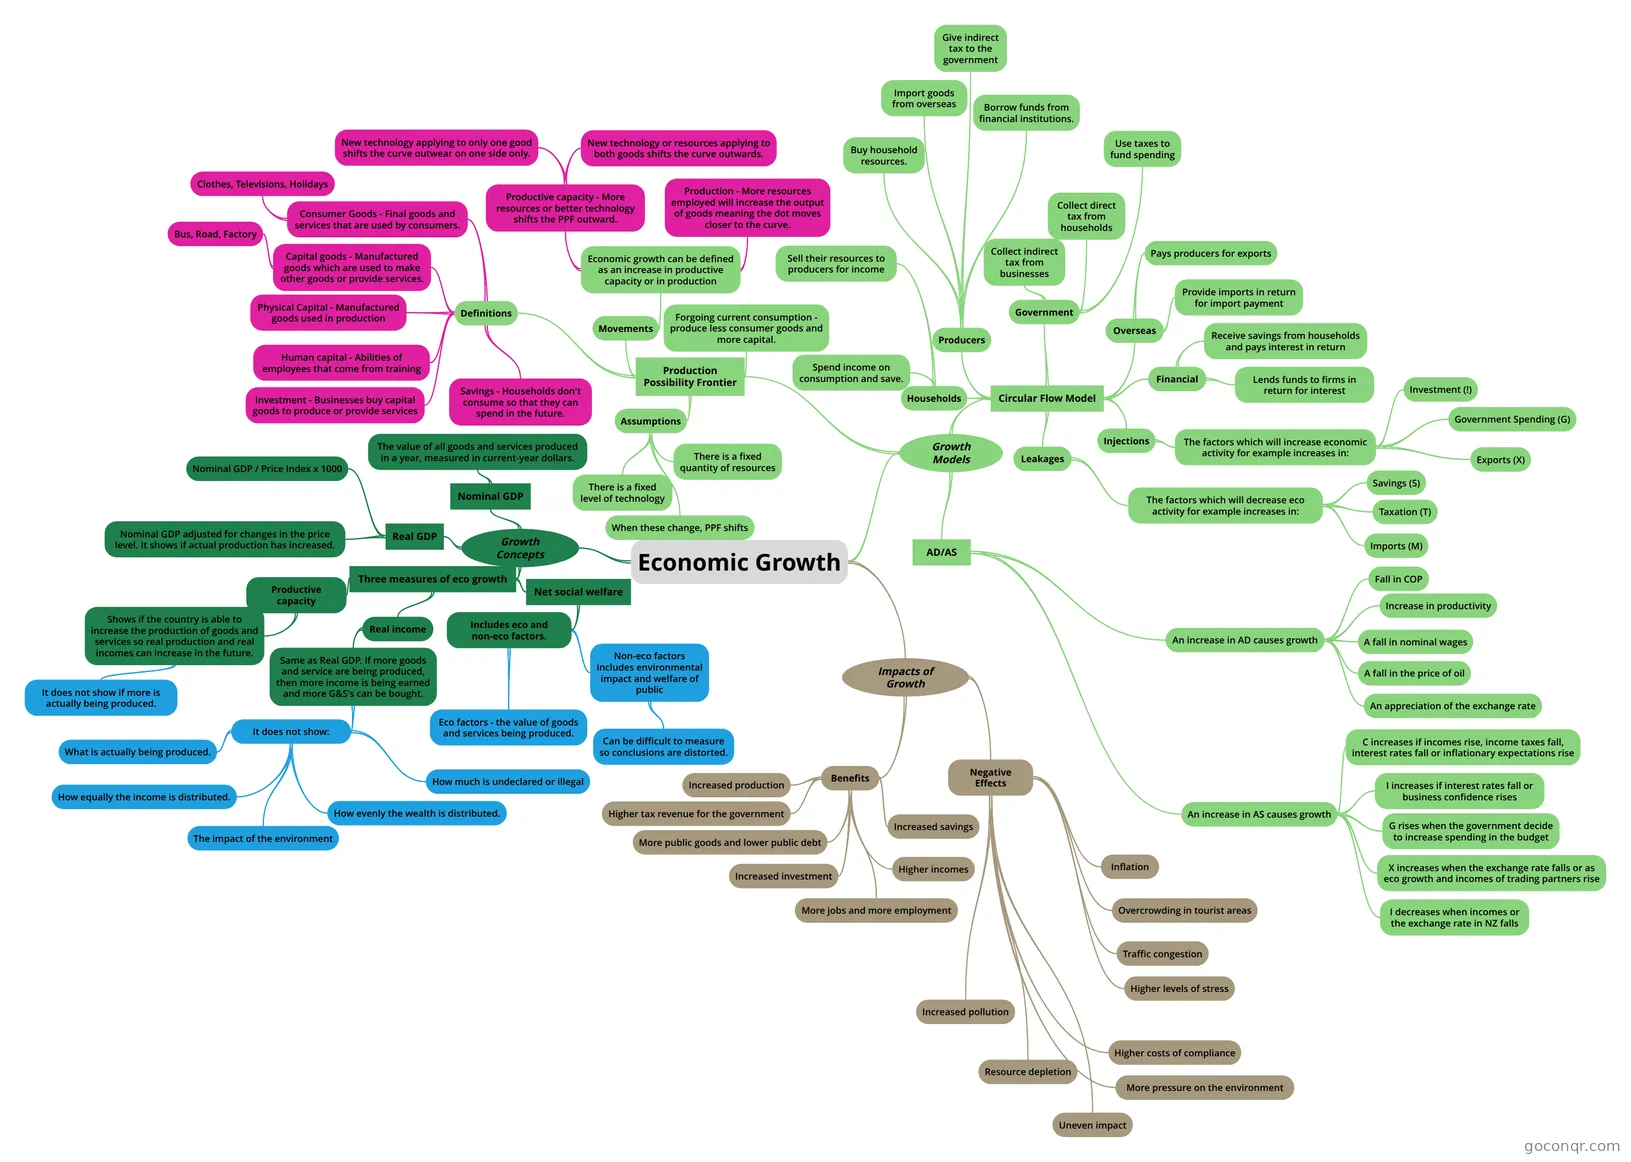
Mind map: Economic growth
Map content
Economic Growth
Growth Concepts
- Nominal GDP
- The value of all goods and services produced in a year, measured in current-year dollars.
- Real GDP
- Nominal GDP adjusted for changes in the price level. It shows if actual production has increased.
- Nominal GDP / Price Index x 1000
- Three measures of eco growth
- Productive capacity
- Shows if the country is able to increase the production of goods and services so real production and real incomes can increase in the future.
- It does not show if more is actually being produced.
- Shows if the country is able to increase the production of goods and services so real production and real incomes can increase in the future.
- Real income
- Same as Real GDP. If more goods and service are being produced, then more income is being earned and more G&S's can be bought.
- It does not show:
- What is actually being produced.
- How equally the income is distributed.
- The impact of the environment
- How much is undeclared or illegal
- How evenly the wealth is distributed.
- It does not show:
- Same as Real GDP. If more goods and service are being produced, then more income is being earned and more G&S's can be bought.
- Net social welfare
- Includes eco and non-eco factors.
- Eco factors - the value of goods and services being produced.
- Non-eco factors includes environmental impact and welfare of public
- Can be difficult to measure so conclusions are distorted.
- Includes eco and non-eco factors.
- Productive capacity
- Nominal GDP
Impacts of Growth
- Benefits
- Increased production
- Increased investment
- More jobs and more employment
- Higher incomes
- Increased savings
- Higher tax revenue for the government
- More public goods and lower public debt
- Negative Effects
- Resource depletion
- Increased pollution
- More pressure on the environment
- Higher costs of compliance
- Higher levels of stress
- Traffic congestion
- Overcrowding in tourist areas
- Uneven impact
- Inflation
- Benefits
Growth Models
- Production Possibility Frontier
- Definitions
- Consumer Goods - Final goods and services that are used by consumers.
- Clothes, Televisions, Holidays
- Capital goods - Manufactured goods which are used to make other goods or provide services.
- Bus, Road, Factory
- Physical Capital - Manufactured goods used in production
- Human capital - Abilities of employees that come from training
- Savings - Households don't consume so that they can spend in the future.
- Investment - Businesses buy capital goods to produce or provide services
- Consumer Goods - Final goods and services that are used by consumers.
- Assumptions
- There is a fixed level of technology
- There is a fixed quantity of resources
- When these change, PPF shifts
- Movements
- Economic growth can be defined as an increase in productive capacity or in production
- Productive capacity - More resources or better technology shifts the PPF outward.
- New technology or resources applying to both goods shifts the curve outwards.
- New technology applying to only one good shifts the curve outwear on one side only.
- Production - More resources employed will increase the output of goods meaning the dot moves closer to the curve.
- Productive capacity - More resources or better technology shifts the PPF outward.
- Economic growth can be defined as an increase in productive capacity or in production
- Forgoing current consumption - produce less consumer goods and more capital.
- Definitions
- Circular Flow Model
- Households
- Sell their resources to producers for income
- Spend income on consumption and save.
- Producers
- Buy household resources.
- Import goods from overseas
- Give indirect tax to the government
- Borrow funds from financial institutions.
- Government
- Collect direct tax from households
- Collect indirect tax from businesses
- Use taxes to fund spending
- Overseas
- Pays producers for exports
- Provide imports in return for import payment
- Financial
- Receive savings from households and pays interest in return
- Lends funds to firms in return for interest
- Injections
- The factors which will increase economic activity for example increases in:
- Investment (!)
- Government Spending (G)
- Exports (X)
- The factors which will increase economic activity for example increases in:
- Leakages
- The factors which will decrease eco activity for example increases in:
- Savings (S)
- Taxation (T)
- Imports (M)
- The factors which will decrease eco activity for example increases in:
- Households
- AD/AS
- An increase in AS causes growth
- C increases if incomes rise, income taxes fall, interest rates fall or inflationary expectations rise
- I increases if interest rates fall or business confidence rises
- G rises when the government decide to increase spending in the budget
- X increases when the exchange rate falls or as eco growth and incomes of trading partners rise
- I decreases when incomes or the exchange rate in NZ falls
- An increase in AD causes growth
- Fall in COP
- Increase in productivity
- A fall in nominal wages
- A fall in the price of oil
- An appreciation of the exchange rate
- An increase in AS causes growth
- Production Possibility Frontier
Information
- Description
- NCEA 3 Economics Mind Map on Economic Growth, created by Emerson Dobbs on 26/10/2014.
- Created by
- Emerson Dobbs
- Views
- 26
- Rating
More on Economic growth and living standards