
Mind map
Physiology

Map content
Physiology
Aerobic adaptations to training
- Factors determining effectiveness
- Training volume
- Training Intensity
- Endurance
- Cardiorespiratory endurance
- Muscular enduarance
- Testing for health and performance
- Heart
- <3 rate
- Echocardiogram
- ECG
- Exercise testing
- Circulatory system
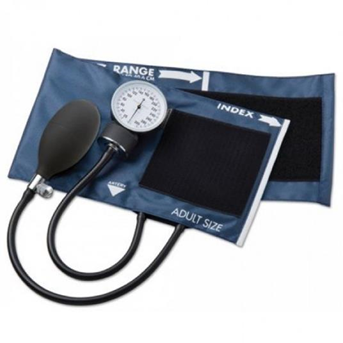
- Blood pressure
- Ultrasound
- Lipid profile
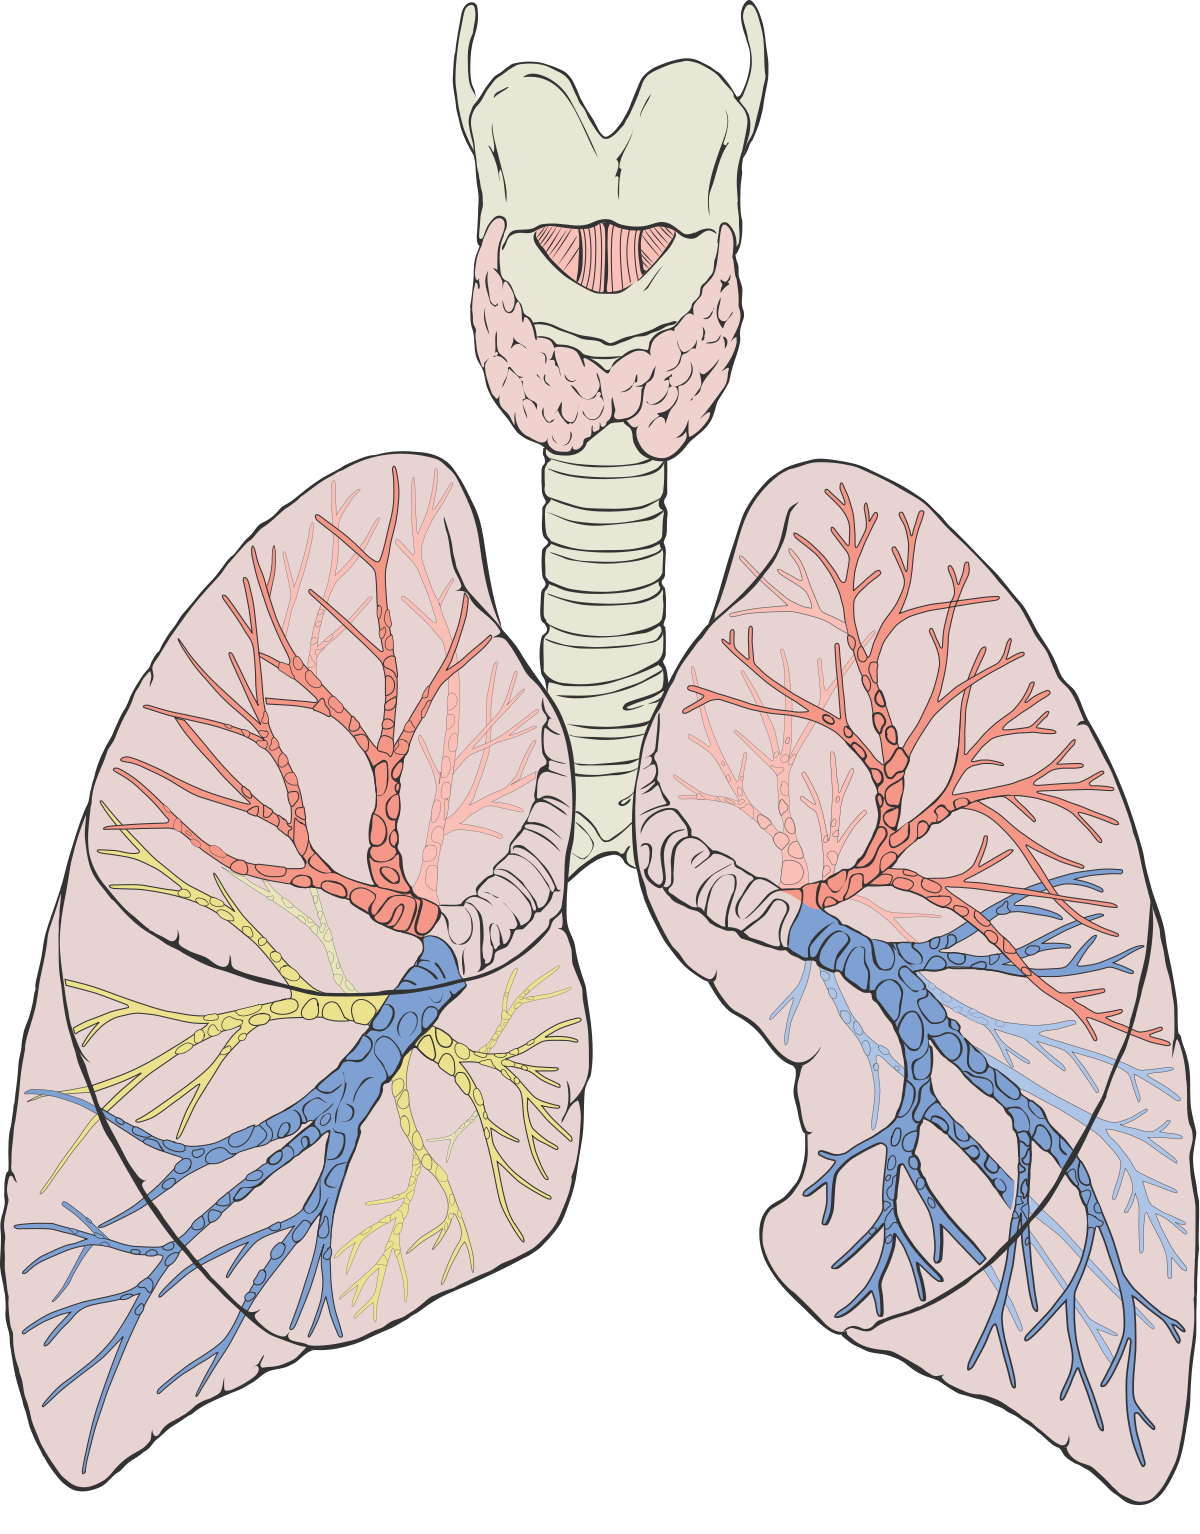
- Respiratory system
- Spirometry
- O2 saturation
- Exercise performance
- Measuring forced expiratory volume
- Health
- Anxiety
- Depression
- Perceived quality of life
- Performance
- Memory
- Dual task
- Executive fx
- Heart
- Lab tests
- Max tests
- Vo2 max testing
- Highest rate of 02 consumption possible during exercise
- Can be increased by 15-20% within 20 weeks
- Expressed as absolute (in L) or relative (ml/kg/min)
- Time to fatigue at V02 max
- 100% = 5min
- 90% = 15 min
- 80% = 45 min
- 70% = 2.5 hours
- 60% = >3hours
- V02 = Q (SV * HR) * A-V (02 diff)
- Astramd treadmill
- Windgate
- Bleep / YOYO
- Vo2 max testing
- Sub-max
- Astrand-rhyming cycle
- Modified Bruce protocols
- PWC 75% and PWC170
- Max tests
- Cardiovascular adaptations
- <3 size
- Especially LV wall (Hypertrophy)
- <3 rate
- Resting HR
- With training RHR can decrease with training - possible to detrain
- Remodelling of SA node - Calcium, Sodium, Potassium
- Q = SV * HR
- Sub max HR
- Lower HR at exercise intensity after training
- Q = SV * HR - therefore if SV has increased - there is a more noticeable at higher intensities
- MAX HR
- 220 - Age
- Elite athletes < sedentary population
- Declines with age
- Faster HR = less filling time = lower SV
- Most efficient combo is a lower HR with greater SV to provide sufficient o2
- HR recovery
- Improved training status = more efficient recovery
- Factors to influence recovery
- Temp
- Mental state
- Distractions post-exercise
- Altitude
- Resting HR
- Stroke volume and Cardiac output
- Increased SV
- SV = EDV - ESV
- Increased End diastolic volume
- Due to increased fitness and a slower HR, The fuller that ventricle is the larger the contraction is
- Decreased End systolic volume
- Stronger contraction = less remaining blood
- RBC volume
- Correlated with Vo2 max
- Ensures body has ability to deliver 02 to exercising muscle
- Haematocrit (% of blood volume that is RBC) decreases
- Greater increase in plasma than RBC
- Athletes can seem anaemic
- Increased Blood flow
- Increased capillirisation
- Angiogenesis
- Formation of new capillaries in trained muscles
- Can increase by up to 15%
- Expressed as capillary to fibre ration (normally 1.1 untrained and 1.5 in trained)
- Angiogenesis
- Better recruitment of existing capillaries
- Not all capillaries are open at one time
- More capillaries open in trained muscles
- Increase in overall surface area for oxygen diffusion
- Greater blood volume
- Total bodily blood increases
- Blood is made of plasma + formed elements
- More effective distribution
- Blood is shunted away from areas that dont need it during exercise
- More blood directed to oxidative muscle fibres
- Away from Glycotic
- increase in plasma after training
- Because of an increase in plasma proteins and a change in oncotic pressure
- Causes more fluid to being reabsorbed into blood vessels
- Exercise causes release of antidiuretic hormone and aldosterone
- Exercise causes release of antidiuretic hormone and aldosterone = reabsorption of H20 and NA in kidneys
- Because of an increase in plasma proteins and a change in oncotic pressure
- Blood pressure adaptations
- Larger influence on those with higher BP after endurance exercise
- @ max exercise - SBP slight increase, DBP little change
- MAP reduced @ sub max intensity
- Increased capillirisation
- Increased SV
- <3 size
- HR max
- Elite athletes have a lower HR max
- declines with age
- Faster HR = ;ess filling time = lower SV
- Improved training status = more efficient recovery period
- Respiratory adaptations
- Pulmonary Ventilation
- Resting PV Unchanged after training
- Increases by 30% at sub max
- Maximum pulmonary ventilation
- Highly trained - 180L/min
- Sedentary - 100-120L/min
- Trained - 130 - 150 L/min
- Large highly trained - 200 L/min
- Variables making up pulmonary ventilation
- Increased tidal volume
- Increased respiratory frequency
- Ventilation not normally a limiting factor
- 02sat < 96% = exercise induced arterial hypoxemia
- Ventilation not normally a limiting factor
- Pulmonary diffusion
- Gas exchange (GE) unaltered at rest and during sub-max exercise
- GE increases at max intensity
- As BF increases so does total perfusion
- As ventialation increases - more pulmonary ventilation occurs
- Number of alveoli increases
- Gas exchange (GE) unaltered at rest and during sub-max exercise
- A-vO2 difference
- With training A-v02 diff increases
- Lower venous O2 content reflects greater 02 extraction
- Pulmonary Ventilation
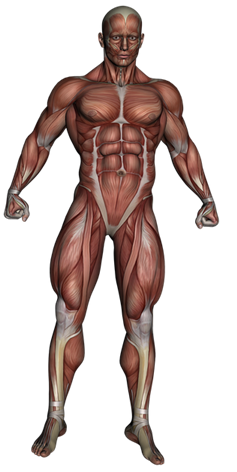
- Muscular adaptations
- Muscle fibre types
- Type l
- Slow twitch - oxidative Increases in X sectional area of 25% have been observed
- INCREASE from 43% pre to 47% post training
- Type lla
- Faster twitch muscle fibres Oxidative capacity
- No change
- Type llx
- Low oxidative capacity
- Decrease from 20% pre to 15% post training
- Type l
- Myoglobin content
- Myoglobin is a protein that shuttles 02 muscle cell membrane to mitochondria
- 2 types: Deoxymyoglobin and Oxymyoglobin
- More present in type l muscle fibres
- Lack of myoglobin in type ll muscle fibres reduces oxidative capacity
- Endurance training can increase muscle myoglobin content by 75%
- If Found in blood stream = sign of muscle injury
- Mitochondria fx
- WHY NB
- Oxidative energy production
- mitochondrial density
- Increase in number and size of mitochondria after endurance training
- Increases of 15% in number and 35% in size after 27 weeks of exercise observed
- Biogenesis and mitophagy
- Exercise slows down the degeneration of mitochondria
- Turnover of mitochondria dependent on a regulator protein: peroxisome proliferator-activated receptor coactivator 1α
- Peroxisome proliferator-activated receptor coactivator 1α
- controls replacement of weakened mitochondria
- Peroxisome proliferator-activated receptor coactivator 1α
- Exercise training (endurance and resistance) improve the expression of this protein.
- WHY NB
- Oxidative enzymes
- WHY NB?
- Responsible for oxidative breakdown of fuels and production of ATP
- Aerobic training increases activity of these enzymes
- Increases in enzyme activity increase beyond VO2max increases
- Training improvements may be limited by circulatory limitations more than muscle oxidative potential
- activity for 20 min / day increases succinate dehydrogrenase activity by more than 25%
- 60 - 90 ,im of training / day = 2 / 3 X increase in enzyme activity
- Glycogen sparing is also improved by exercise – slower rate of glycogen utilisation and more reliance on fat at any intensity.
- WHY NB?
- Muscle fibre types
- Factors determining effectiveness
Images and files in the map

Information
- Description
- Mind Map on Physiology, created by Duray Pretorius on 24/09/2019.
- Created by
- Duray Pretorius
- Views
- 0
- Rating