
Mind map
Population Size & Ecosystems
Map content
Population Size & Ecosystems
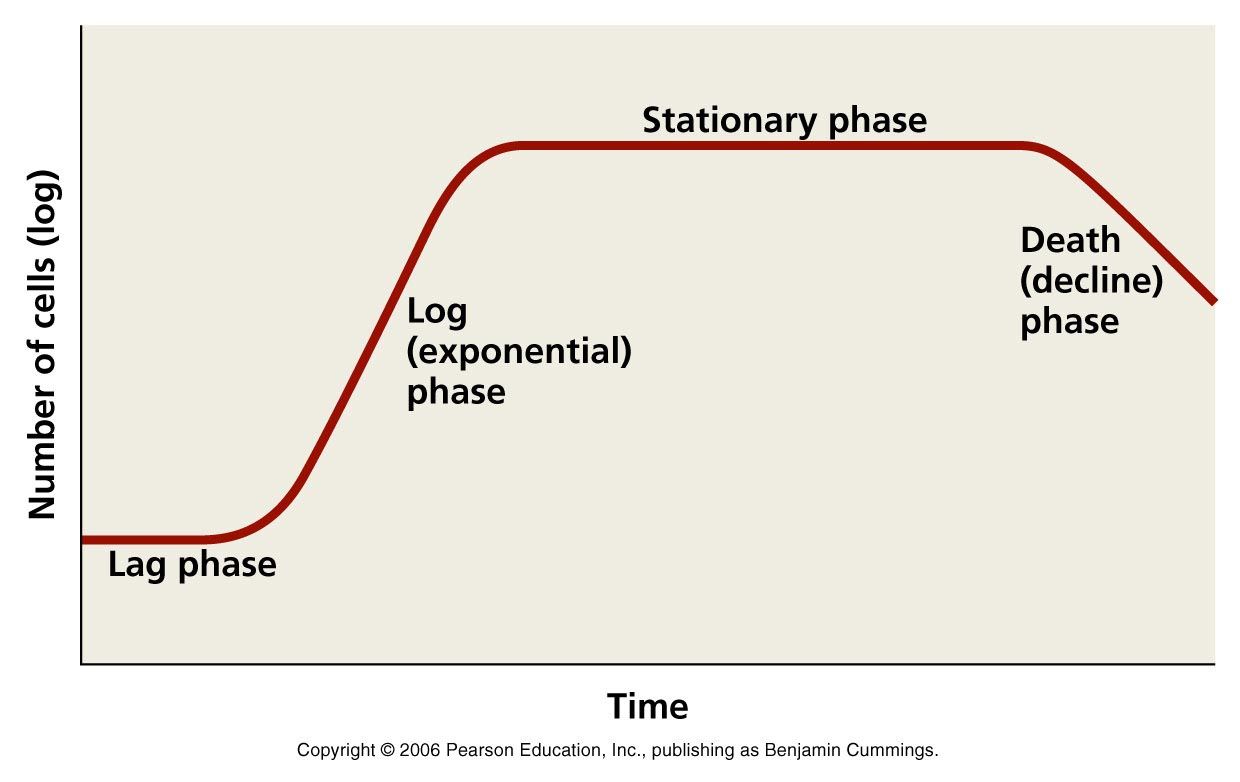
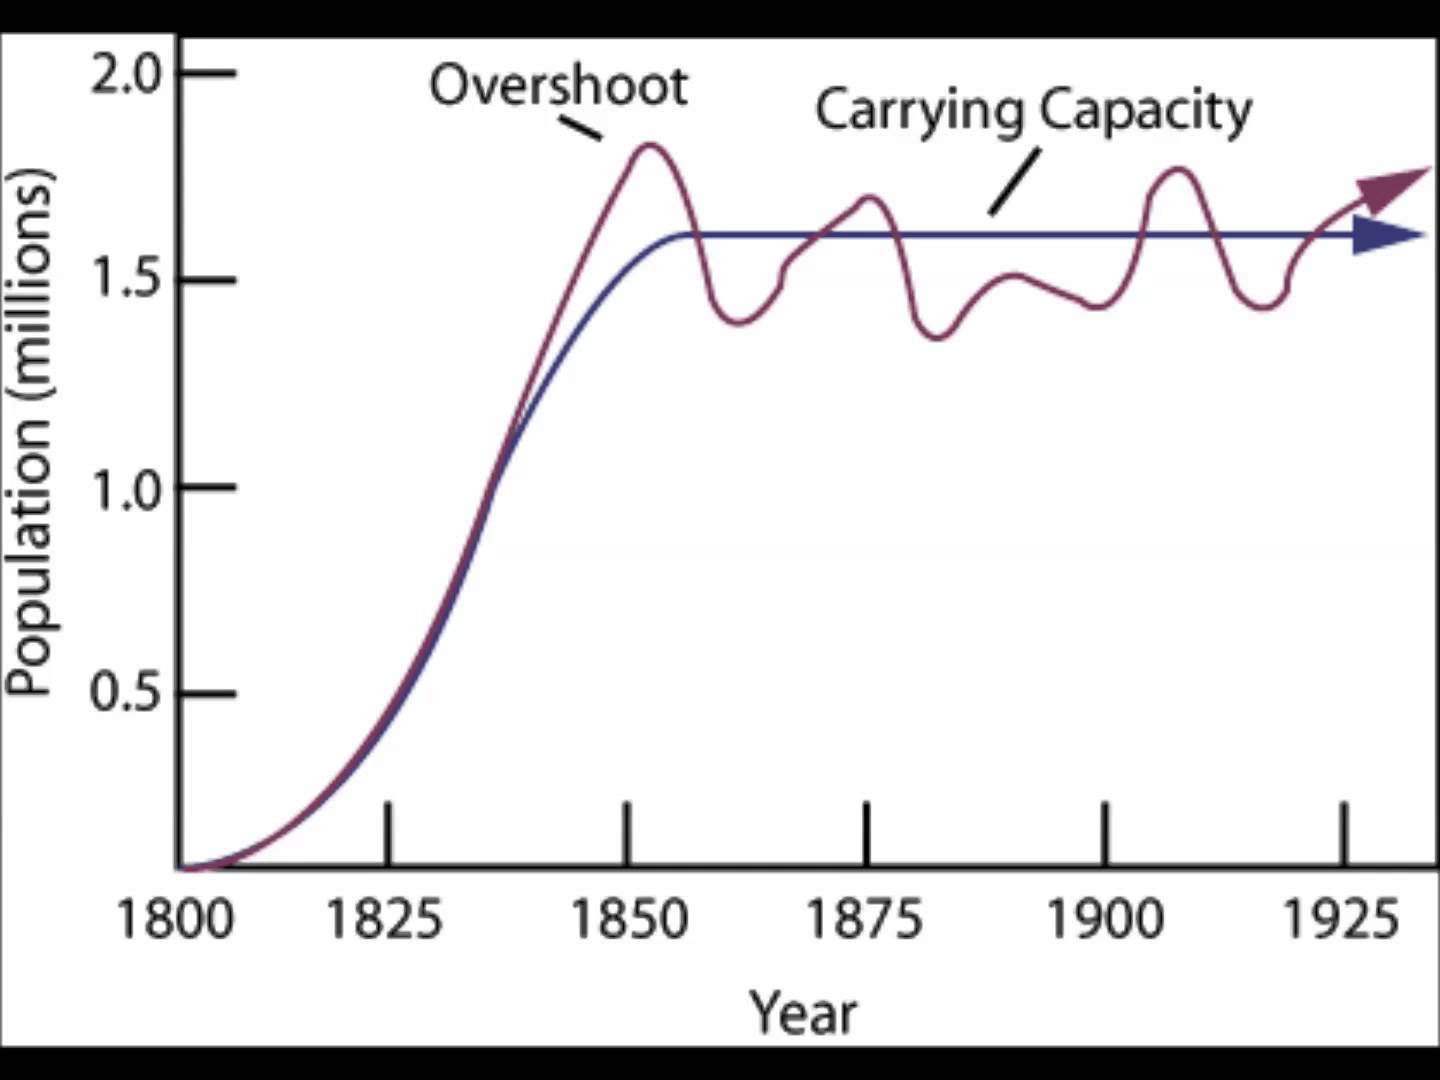
Population graphs
- Oscillations
- Predator-prey relationship causes both populations to oscillate
- Sigmoid growth: usual pattern of growth= 1 step growth curve
- Oscillations
Density-Dependent Factors
- Environmental factors that have more effect if the populations in a given area is large
- Disease, parasitism, predation, depletion of food supply
- Biotic
Density-Independent Factors
- Abiotic
- Effect is the same regardless of population size
- Temperature
Ecosystems: A characteristic community of interdependent species interacting with the abiotic components of their habitat
- A sequence of energy changes
Abundance: The number of individuals in a species in a given area or volume
- Capture-mark-recapture
- Kicksampling
- Quadrat
- Kite diagrams
Distribution: The area/volume in which the organism of a species are found
- Transect
- Belt transect
- Line transect
- Transect
Food Chains
- Energy leaves the system as heat
- Length is dependent on
- -The energy that enters the food chain at the 1st trophic level -Efficiency of energy transfer between trophic levels -Predator and prey population -Size of the ecosystem: larger=longer
- Photosynthetic efficiency: A measure of the ability of a plant to trap light energy
- -Wrong wavelength of light -Light can be reflected -Light can be transmitted straight through the leag
- Efficiency of energy transfer= Energy incorporated into biomass after transfer/ Energy available in biomass before transfer
- There is a loss from the food chain at each level
- -There is energy in molecules that are egested -Energy is lost as heat due to respiration - Energy remains in molecules in parts of animal that may not be eaten e.g. horns
Ecological Pyramids
- Pyramid of Numbers
- Does not take into account the size of the organisms
- Area of the pyramid bar is proportional to the total number at each trophic level
- Pyramid of Energy =feeding relationships
- Area of bar decreases =energy loss from the ecosystem
- Easy to compare the efficiency of energy transfer between trophic levels
- Pyramid of Biomass
- Inverted pyramid
- Hard to measure accurately
- Pyramid of Numbers
Succession
- Climax community equilibrium
- GPP=Respiration
- Constant quantity of humus
- Complex food web
- Bare rock ---> Deciduous forest
- 1. Algae and lichen colonise the rock=pioneer community
- 2. Formation of primitive soil
- 3. As soil develops, herbaceous plants outcompete mosses. Seeds that can germinate in direct sunlight are favoured
- 4.Tall grass starts to grow. Shade-tolerant species are established
- 5. Soil thickens as plants and animals start to die
- 6. Shrubs outcompete herbaceous plants
- 7. Soil deepens which increases the quantity of minerals and humus in the soil
- 8. Large trees outcompete shrubs
- 7. Soil deepens which increases the quantity of minerals and humus in the soil
- 6. Shrubs outcompete herbaceous plants
- 5. Soil thickens as plants and animals start to die
- 4.Tall grass starts to grow. Shade-tolerant species are established
- 3. As soil develops, herbaceous plants outcompete mosses. Seeds that can germinate in direct sunlight are favoured
- 2. Formation of primitive soil
- 1. Algae and lichen colonise the rock=pioneer community
- Secondary succession
- Same sequence as primary succession but it's more rapid
- Factors affecting succession
- Human interference
- Over-grazing
- Farming of land
- Deforestation
- Migration
- Arrival of spore, seeds and animals
- Competition amongst organisms
- Intraspecific-between individuals of the same species
- Interspecific- between individuals of different species
- Human interference
- Climax community equilibrium
Human Impact on the Carbon Cycle
- Deforestation
- Climate Change
- Agriculture is vulnerable
- Global Warming
- Enhanced greenhouse gas effect
Human Impact on the Nitrogen Cycle
- Fertiliser effects
- Increase in nitrates
- Decrease in species diversity
- Harms all ecosystems
- Increase in nitrates
- Eutrophication
- Sewage and fertilisers leak into bodies of water
- Fertiliser effects
Carbon footprint
Nitrogen fixation
Nitrification
Ammonification
Denitrification
Images and files in the map
Information
- Description
- A level Biology Mind Map on Population Size & Ecosystems, created by Celina Gupta on 06/05/2017.
- Created by
- Celina Gupta
- Views
- 51
- Tags
- Rating