
Mind map
Populations in Transition
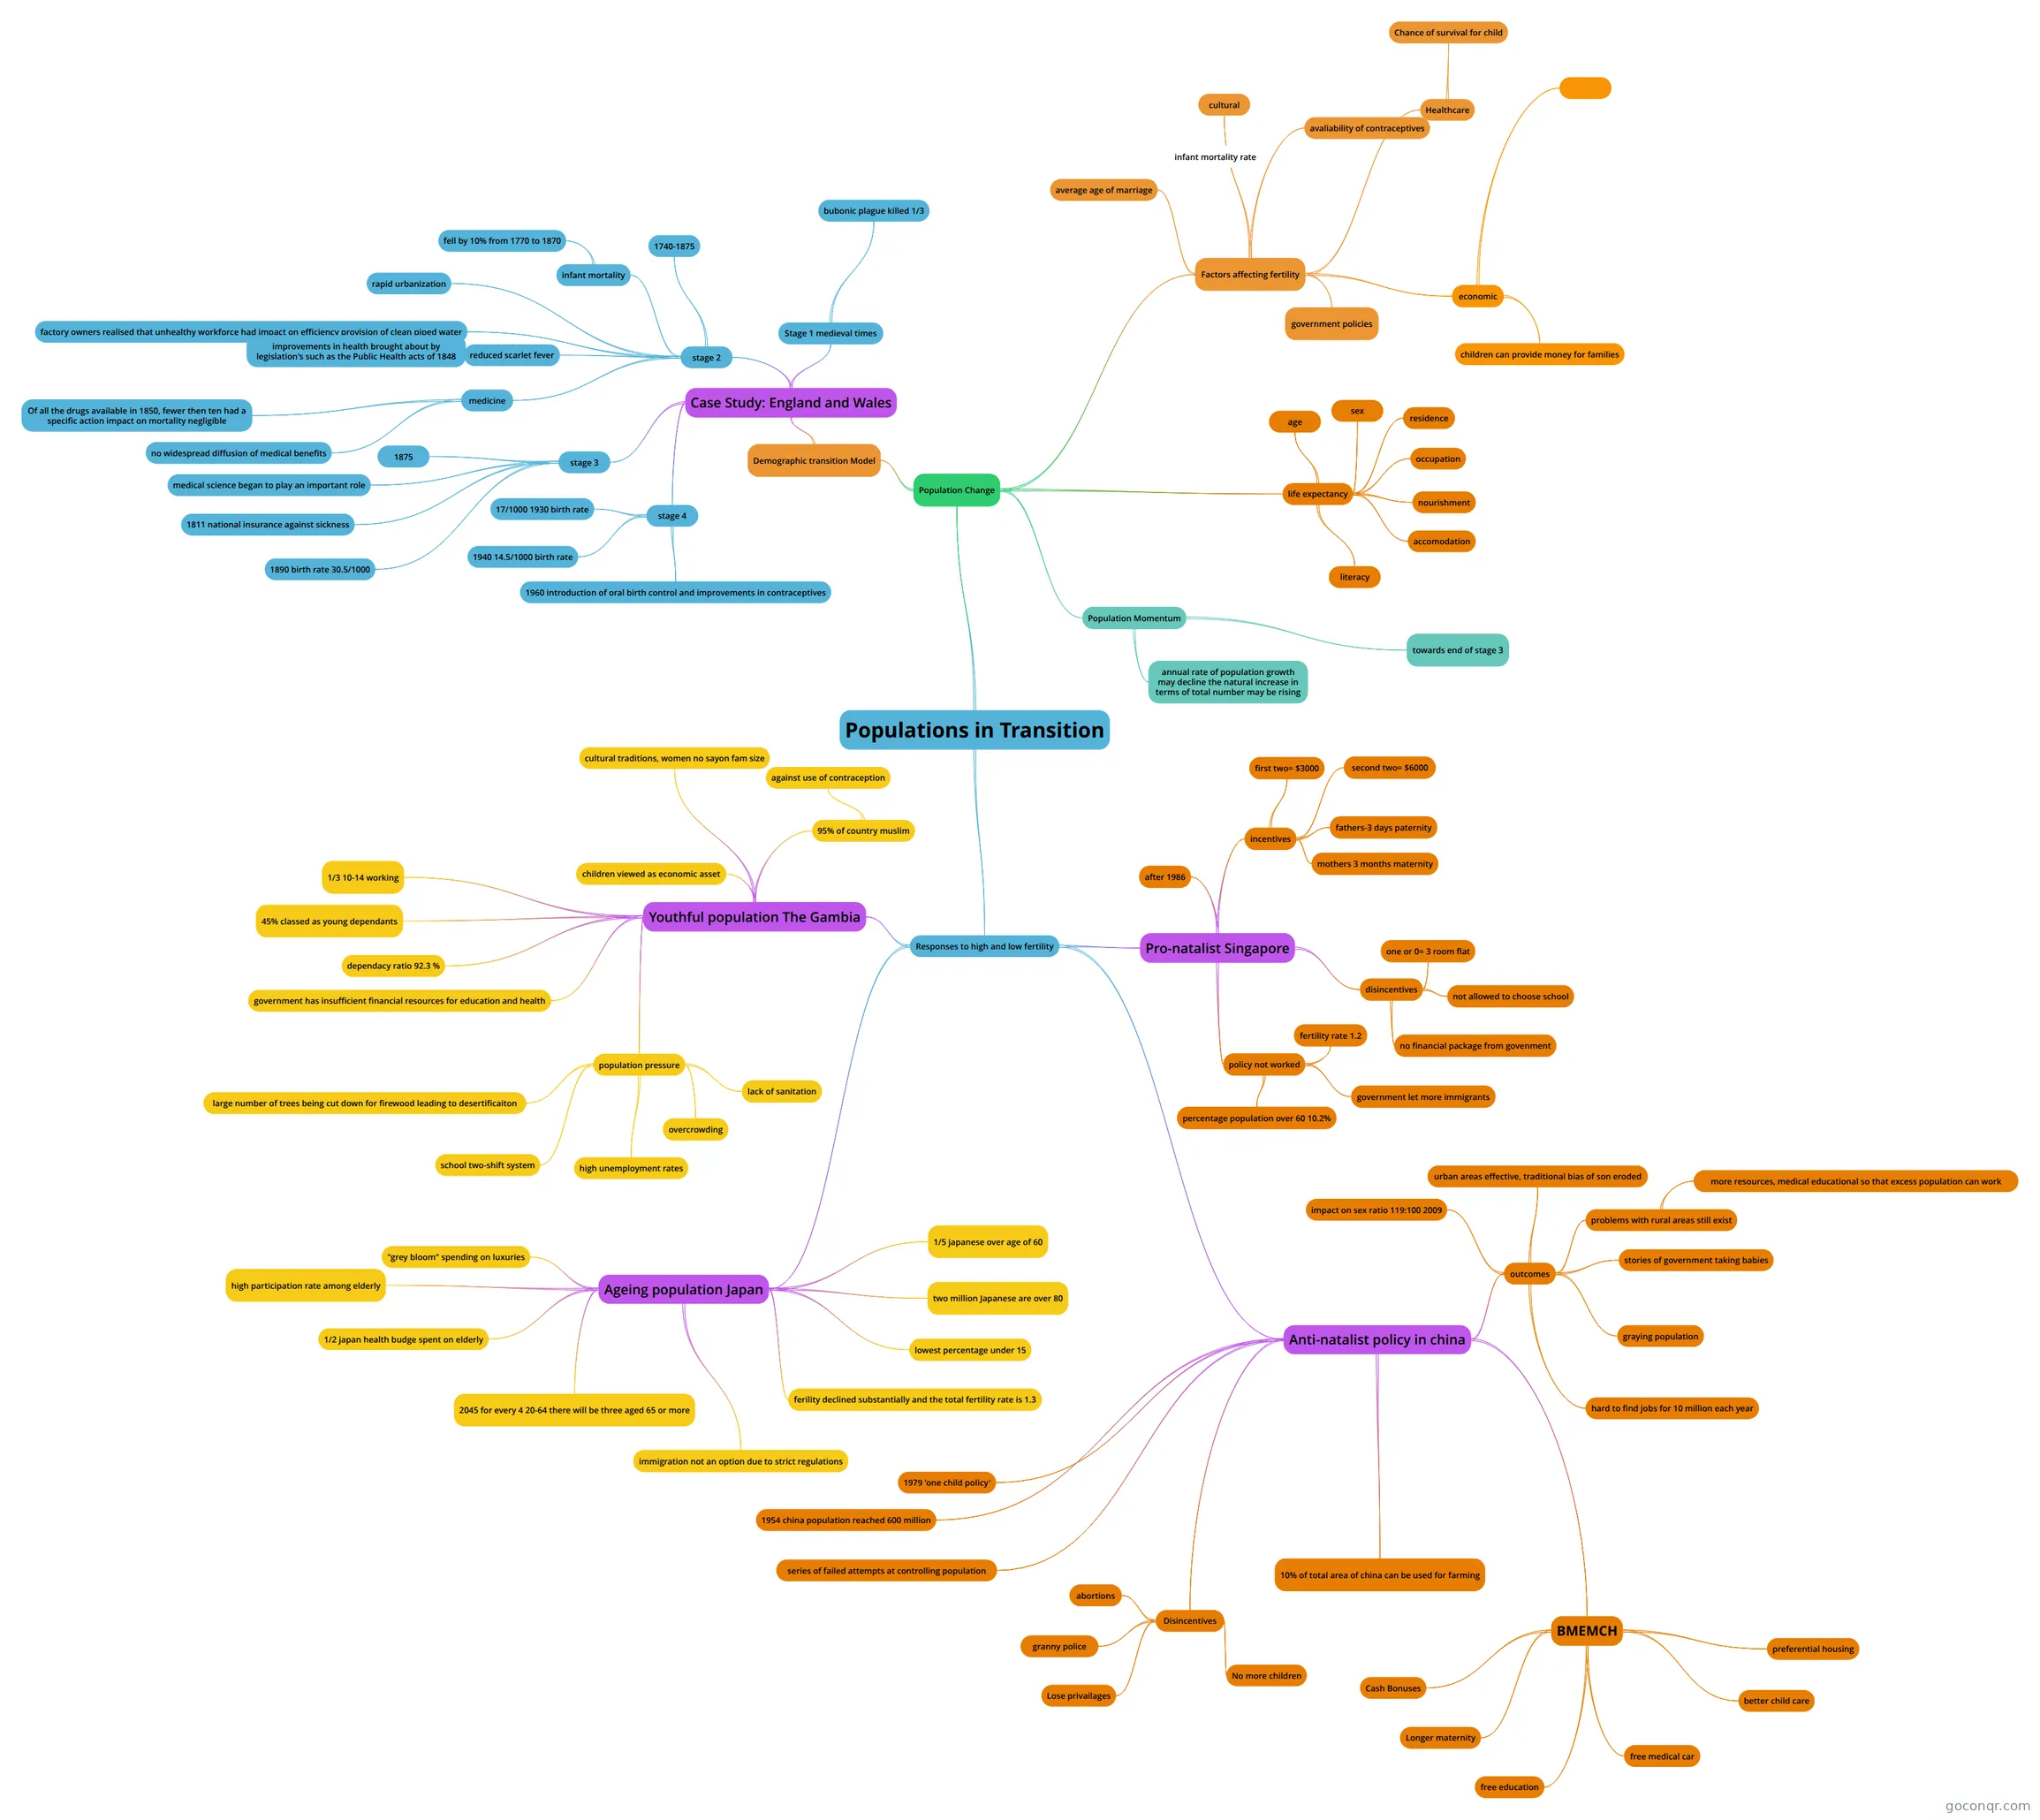
Mind map: Populations in transition
Map content
Populations in Transition
Population Change
- Demographic transition Model
- Case Study: England and Wales
- Stage 1 medieval times
- bubonic plague killed 1/3
- stage 2
- 1740-1875
- rapid urbanization
- factory owners realised that unhealthy workforce had impact on efficiency provision of clean piped water
- infant mortality
- fell by 10% from 1770 to 1870
- reduced scarlet fever
- improvements in health brought about by legislation's such as the Public Health acts of 1848
- medicine
- no widespread diffusion of medical benefits
- Of all the drugs available in 1850, fewer then ten had a specific action impact on mortality negligible
- stage 3
- 1875
- medical science began to play an important role
- 1811 national insurance against sickness
- 1890 birth rate 30.5/1000
- stage 4
- 17/1000 1930 birth rate
- 1940 14.5/1000 birth rate
- 1960 introduction of oral birth control and improvements in contraceptives
- Stage 1 medieval times
- Case Study: England and Wales
- Factors affecting fertility
- economic
- children can provide money for families
- government policies
- Healthcare
- Chance of survival for child
- cultural
- average age of marriage
- avaliability of contraceptives
- economic
- Population Momentum
- towards end of stage 3
- annual rate of population growth may decline the natural increase in terms of total number may be rising
- life expectancy
- age
- sex
- residence
- occupation
- nourishment
- accomodation
- literacy
- Demographic transition Model
Responses to high and low fertility
- Pro-natalist Singapore
- incentives
- first two= $3000
- second two= $6000
- fathers-3 days paternity
- mothers 3 months maternity
- disincentives
- one or 0= 3 room flat
- not allowed to choose school
- no financial package from govenment
- after 1986
- policy not worked
- fertility rate 1.2
- percentage population over 60 10.2%
- government let more immigrants
- incentives
- Youthful population The Gambia
- 95% of country muslim
- against use of contraception
- 1/3 10-14 working
- 45% classed as young dependants
- dependacy ratio 92.3 %
- population pressure
- overcrowding
- lack of sanitation
- high unemployment rates
- school two-shift system
- large number of trees being cut down for firewood leading to desertificaiton
- government has insufficient financial resources for education and health
- cultural traditions, women no sayon fam size
- children viewed as economic asset
- 95% of country muslim
- Ageing population Japan
- 1/5 japanese over age of 60
- two million Japanese are over 80
- ferility declined substantially and the total fertility rate is 1.3
- lowest percentage under 15
- high participation rate among elderly
- immigration not an option due to strict regulations
- 2045 for every 4 20-64 there will be three aged 65 or more
- "grey bloom" spending on luxuries
- 1/2 japan health budge spent on elderly
- Anti-natalist policy in china
- 10% of total area of china can be used for farming
- 1954 china population reached 600 million
- series of failed attempts at controlling population
- 1979 'one child policy'
- Disincentives
- granny police
- Lose privailages
- No more children
- abortions
- BMEMCH
- Cash Bonuses
- Longer maternity
- free education
- free medical car
- better child care
- preferential housing
- outcomes
- impact on sex ratio 119:100 2009
- urban areas effective, traditional bias of son eroded
- stories of government taking babies
- hard to find jobs for 10 million each year
- graying population
- problems with rural areas still exist
- more resources, medical educational so that excess population can work
- Pro-natalist Singapore
Information
- Description
- International Baccalaureate Geography (populations in transition) Mind Map on Populations in Transition, created by philippe miranthis on 09/05/2017.
- Created by
- philippe miranthis
- Views
- 0
- Rating