Page 1
Statistic = a quantity calculated from the data. Statistics = the discipline, or field of study, concerned with using these quantities. Descriptive statistics = describe or summarize the main characteristics of a sample of population. Inferential statistics = draw conclusions from data, in particular, statistical hypothesis testing. Empirical evidence = a source of knowledge acquired through observation and experimentation. Hypothesis testing = develop a "model", collect data, check whether the model fits the data.
01 - Introduction to Statistics
Statistics is used as a way to organize data, as: most data is "noisy' - varies unsystematically. different sources of data variation - some systematic, some unsystematic. can be difficult to discern real patterns from chance ones. The purpose of statistical tests is to objectively assess the probability that a given result was due to chance.
02 - Probability, Data, Populations and Samples
Probability = numerical description fo the likely occurence of a given event. usually written as "p". expressed as a value ranging from 0 to 1 (1 - definitely likely to occur, 0 - definitely not likely to occur). p=0.5 is the same as 50% likelihood, or a 1/2 chance. Fundamental theoremsAssume that event A and event B are mutually exclusive (cannot happen simultaneously). p(A or B) = p(A) + p(B). Toss coin once: probability of either heads or tails = P(head) + P(tail) = 0.5 +0.5 = 1 p(A and B) = p(A) x p(B). Toss coin twice: probability of a head, then a tail = P(head) x P(tail) = 0.5 x 0.5 = 0.25
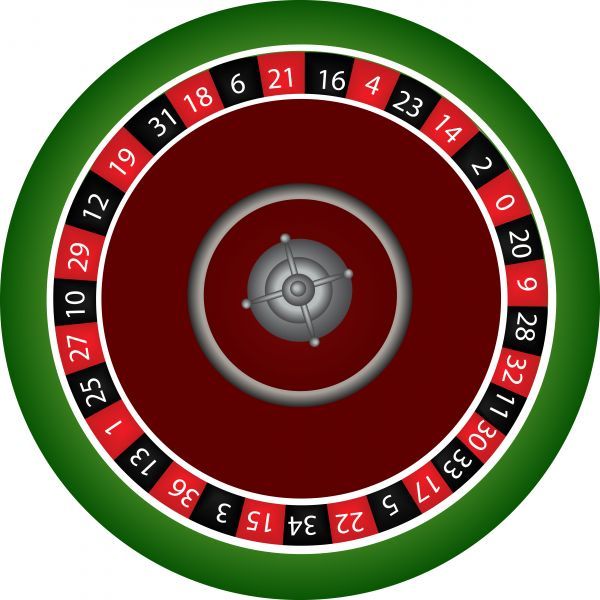
Roulette example - Monte Carlo casino on 18th August 1913. Black came up 20 times in a row.Slots numbered 0-36. 18 red (p=18/37=0.4865) 18 black (p=18/37 = 0.4865) 1 green (p=1/37 = 0.027) Gamblers fallacy/Monte Carlo fallacy/"Maturity of Chances" doctrine."when an event happens more often than predicted in the past, this will be balance by the event happening less often than predicted in the future" NOT true when the event in question is truly random.Each event is independent of all others.It's a misunderstanding of the Law of Large Numbers.Law of Large Numbers = The more observations made, the closer the observed distribution of results will match the expected distribution of results.
Types of data (measurements/variables)Categorical: Binary (2 discrete categories) e.g. gender Nominal (more than 2 discrete categories) e.g. cities Ordinal (categories have order) e.g. gold, silver, bronze medals, old/young Continuous:Scale (equal intervals between scores, i.e. numbers) e.g. temperature, exact age in years
Populations and SamplesAll of statistics involves making inferences about populations about what those populations look like (descriptive statistics) about relationships between populations (inferential statistics) Population = entire collection of potentially observable measures for a variable of interest.sample = some of the measures from the population. Designed to be representative of the population (big and random > small and biased).
then
0.5 x 0.5 = 0.25
OR
0.5 + 0.5 = 1
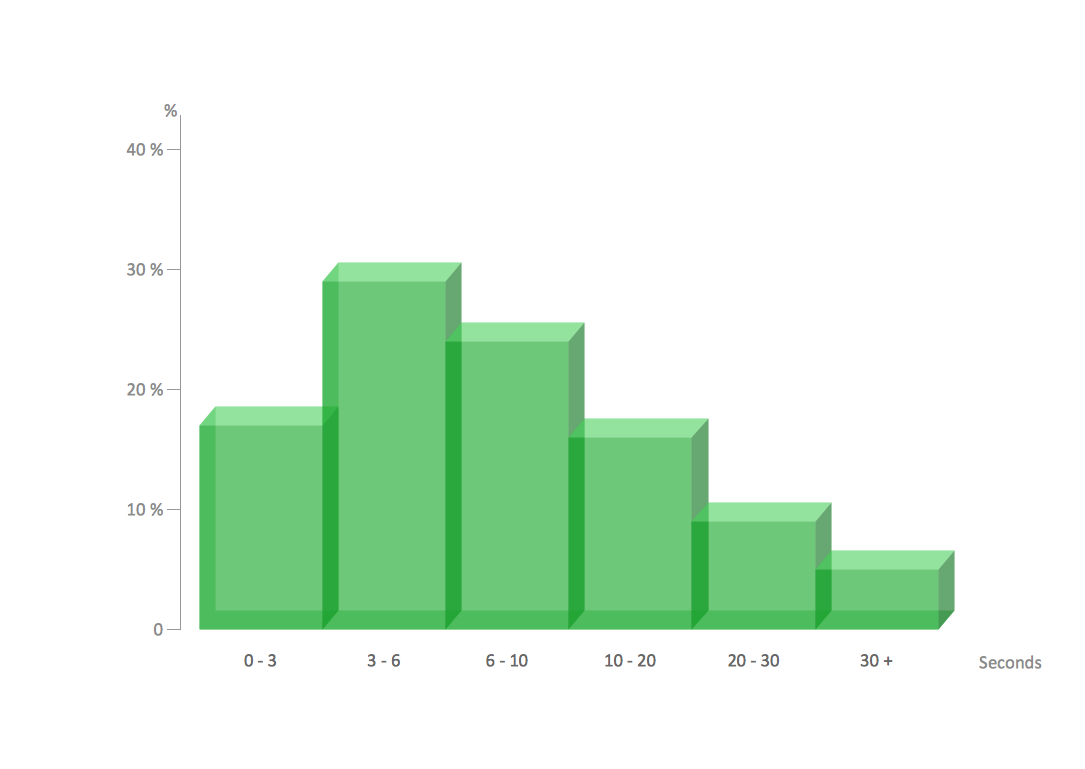
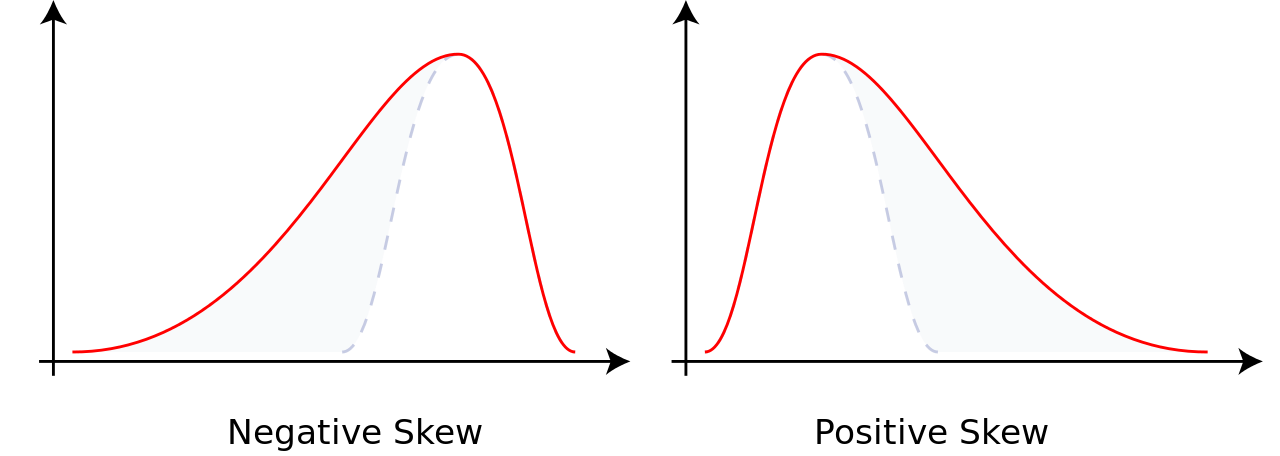
Orange Tree ExampleFarmer has over 1000 trees, counted number of oranges on 61 trees.n=61.Frequency distribution (histogram) = graphical depiction showing how sample scores/values are distributed (i.e. how often they occur): entire range of scores divided into "bins" of equal size. count the number of observations grouped into each bin. plot, with bin values on x-axis and number of observations (frequency) on y-axis. Range from 60 oranges to 140 oranges.Make bin size 5 for example. First bin = 60-64, 2nd = 65-69, etc.Properties of Frequency DistributionSkew Distribution asymmetry Positive skew (bunched at low values - "right skewed") negative skew ( bunched at high values - "left skewed") Kurtosis The 'heaviness' of the tails Leptokurtic (left) = 'heavy' tails Platykurtic (right) = light tails (but big shoulders)
01 - intro
02 -
Want to create your own Notes for free with GoConqr? Learn more.