18667132
Description
Quiz by Lauren Bruynis, updated more than 1 year ago
|
|
Created by Lauren Bruynis
almost 5 years ago
|
|
Question 1
Question
The term statistical significance means
Answer
-
the test statistic is close to what we would expect if the null hypothesis is true.
-
the null hypothesis is true.
-
the result we see is unlikely to happen just by random chance.
-
the results are important and will make a practical difference in the lives of the subjects.
Question 2
Question
An environmental researcher is concerned that a new industrial plant has made the water in a nearby stream more acidic. The pH measures the amount of acidity or alkalinity of a substance (Pure water would have a pH of 7, numbers lower than 7 indicate acids, numbers greater than 7 indicate alkaline bases). The researcher collects 40 water samples and has found an average pH of 5.9. The researcher would like to conduct a test of hypothesis to determine if the water is significantly acidic.
Select all of the correct null and alternative hypotheses.
Answer
-
H0: μ = 7
-
H0: μ = 5.9
-
H0: μ = 0
-
Ha: μ < μ0
-
Ha: μ > μ0
-
Ha: μ ≠ μ0
Question 3
Question
The local Sheriff is concerned about speeding at a particular intersection. He selects a random sample of 30 hours over the course of a month and records the average speed of all vehicles that travel through that intersection during each hour. The overall average speed was found to be 36.2 miles per hour. The sheriff would like to conduct a hypothesis test to determine if the overall average speed is significantly higher than 35 miles per hour.
Select all of the correct null and alternative hypotheses.
Answer
-
Ho: μ = 36.2
-
Ho: μ = 35
-
Ho: y¯ =36.2
-
Ha: μ > 35
-
Ha: μ < 35
-
Ha: μ ≠ 35
Question 4
Question
The director of student health at a large university was concerned that students at his school were consuming too many calories each day. For a certain population of college-age students, it is recommended to consume around 2,000 calories/day. The director would like to test the hypothesis that
H0:μ=2000 vs. HA:μ>2000.
In a random sample of 50 students the director found that the average was 2105 calories/day with a standard deviation of 288 calories/day. Calculate the appropriate test statistic for this situation.
Round your answer to 3 decimal places.
Answer: [blank_start]0.005[blank_end]
Answer
-
2.578
Question 5
Question
The p-value is generically defined as: the proportion of the null distribution that is equal to or more extreme than the test statistic. There are many other ways to communicate the idea of what a p-value represents (i.e. other ways to word the definition). Which of the following are also valid ways to define a p-value?
Hint: the p-value is a probability (recall: proportion under a distribution = area under the curve = probability); think carefully about each of the probabilities described below--are the consistent with the definition of the p-value or not?
Answer
-
The p-value represents the probability of observing the test statistic or something more extreme, if the null hypothesis were true.
-
The p-value represents the probability of observing the test statistic or something more extreme, if the alternative hypothesis were true.
-
The p-value represents the probability that the null hypothesis is true.
-
The p-value represents the probability that the alternative hypothesis is true.
Question 6
Question
Do students study less than 150 minutes (2.5 hours), on average, each week? A survey of 51 randomly selected students finds that on average students study 138 minutes per week with a standard deviation of 32 minutes. A hypothesis test based on this data produces a test statistic of -2.68 and a p-value of 0.005. What are the appropriate decision and conclusion at the 5% significance level?
Answer
-
Reject the null hypothesis.
-
Do not reject the null hypothesis.
-
There is enough evidence to claim that students study less than 150 minutes, on average, each week.
-
There is not enough evidence to claim that students study less than 150 minutes, on average, each week.
Question 7
Question
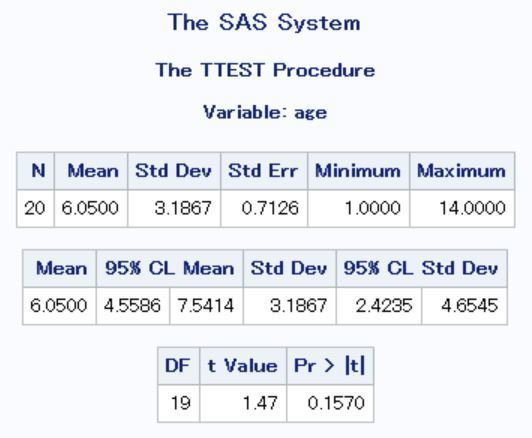
SAS output based on the car data from Discussion 4 is shown below.
Recall: Data was collected on a random sample of 20 undergraduate students who have a college parking permit at Mid-South State University. These students were asked to report the characteristics of their cars including:
Age: The age of the car in years.
Miles: The number of miles the car was driven during the week of the study. Students were notified at the beginning of the study week and asked to track the number of miles driven.
You may assume that all of the students responded and gave accurate information.
You can use proc ttest to conduct a hypothesis test for a mean in SAS. For simplicity, SAS output of the hypothesis test for age is shown below.
This output shows several summary measures (sample size, mean, standard deviation, standard error of the sample mean, minimum and maximum values) and even confidence intervals for the mean and for the standard deviation. (A files with similar annotated output is posted to the top of the course Moodle page).
The very last table shows the test statistic (t = 1.47) and the 2-sided p-value (which is 0.1570). This p-value is testing the following hypotheses:
Ho: μ = 5
Ha: μ ≠ 5.
Consider instead if we had wanted to test these hypotheses:
Ho: μ = 5
Ha: μ > 5.
What would be the appropriate interpretation of the p-value for this test?
Answer
-
The p-value is the proportion of the null distribution that is equal to or more extreme than 1.47.
-
The p-value is the proportion of the null distribution that is greater than or equal to 1.47.
-
The p-value is the proportion of the null distribution that is less than or equal to 1.47.
Question 8
Question
SAS output based on the car data from Discussion 4 is shown below.
Recall: Data was collected on a random sample of 20 undergraduate students who have a college parking permit at Mid-South State University. These students were asked to report the characteristics of their cars including:
Age: The age of the car in years.
Miles: The number of miles the car was driven during the week of the study. Students were notified at the beginning of the study week and asked to track the number of miles driven.
You may assume that all of the students responded and gave accurate information.
You can use proc ttest to conduct a hypothesis test for a mean in SAS. For simplicity, SAS output of the hypothesis test for age is shown below.
This output shows several summary measures (sample size, mean, standard deviation, standard error of the sample mean, minimum and maximum values) and even confidence intervals for the mean and for the standard deviation. (A files with similar annotated output is posted to the top of the course Moodle page).
The very last table shows the test statistic (t = 1.47) and the 2-sided p-value (which is 0.1570). This p-value is testing the following hypotheses:
Ho: μ = 5
Ha: μ ≠ 5.
What is the numeric value of the p-value described in the previous question?
Report your answer to 4 decimal places.
Answer: [blank_start]0.0785[blank_end]
Answer
-
0.0785
Question 9
Question
A large company wanted to know how the average salary of their employees had changed over the last year. The results of their study had a p-value of 0.12 and showed that the average salary had increased by $5,000 from $20,000 to $25,000. What should we conclude about the results of this study?
Answer
-
The results were practically significant but not statistically significant.
-
The results were statistically significant but not practically significant.
-
The results were both statistically significant and practically significant.
-
The results were neither statistically significant nor practically significant.
Question 10
Question
A researcher wanted to know if there was a difference in the number of microscopic particles in bottled water versus filtered tap water. A typical glass of water has hundreds of millions of microscopic particles in it. Her study found a mean difference of 12 microscopic particles between bottled and filtered tap water which had a p-value of .55. What should we conclude about the results of this study?
Answer
-
The results were neither statistically significant nor practically significant.
-
The results were both statistically significant and practically significant.
-
The results were practically significant but not statistically significant.
-
The results were statistically significant but not practically significant.
Question 11
Question
A pharmaceutical company has developed a new drug to help people fall asleep faster. A competing drug claims that it helps people fall asleep 30 minutes faster, on average. This company wishes to test the hypothesis that their drug helps people fall asleep even faster than that: Ho: μ = 30 vs. Ha: μ > 30. Define a Type I and a Type II Error in this context.
Answer
-
A Type II Error would be the company deciding their drug does help people fall asleep faster (than the competitor) when in fact it does not.
-
A Type I Error would be the company deciding their drug does help people fall asleep faster (than the competitor) when in fact it does not.
-
A Type I Error would be the company deciding their drug does not help people fall asleep faster (than the competitor) when in fact it does.
-
A Type II Error would be the company deciding their drug does not help people fall asleep faster (than the competitor) when in fact it does.
Question 12
Question
A pharmaceutical company has developed a new drug to help people fall asleep faster. A competing drug claims that it helps people fall asleep 30 minutes faster, on average. This company wishes to test the hypothesis that their drug helps people fall asleep even faster than that: Ho: μ = 30 vs. Ha: μ > 30.
Consider the drug testing hypotheses. Define statistical power in the context of this problem.
Answer
-
Power would be the probability the company decides their drug does not help people fall asleep faster (than the competitor) when in fact it does not.
-
Power would be the probability of not making a Type I Error.
-
Power would be the probability of not making a Type II Error.
-
Power would be the probability the company decides their drug does help people fall asleep faster (than the competitor) when in fact it does.
Question 13
Question
Suppose a hypothesis test for a population mean is correctly conducted and the decision is made to not reject the null hypothesis. What type of error could have been made?
Answer
-
a. Either type of error could have been made.
-
b. A Type II Error
-
c. A Type I Error
-
d. Neither type of error could have been made if the test was conducted correctly.
Question 14
Question
A large midwestern state administers a state wide mathematics exam that has an average of 500. A researcher is designing a study to test the idea that students from charter schools score higher than average on the test. The researcher plans to take a random sample of 100 students from charter schools. He will then carry out a test of hypothesis using a significance level of 0.01. Which of the following will increase the power of this test? (pick all that apply).
[Note: this question is not asking about appropriate ways to increase power, just about what increases power in general.]
Answer
-
a. If the researcher takes the mathematics test himself.
-
b. If the researcher uses a significance level of 0.001.
-
c. If the researcher talks with 50 students.
-
d. If the researcher talks with 500 students.
-
e. If the researcher uses a significance level of 0.05.
Question 15
Question
For each of the following scenarios, say whether the data should be treated as independent or paired samples.
An efficiency expert claims that a new ergonomic desk chair makes typing at a computer faster and easier. To test this, 15 volunteers are selected. Using both the new chair and their old chair, each volunteer types a randomly selected passage for 2 minutes and the number of correct words typed is recorded. [blank_start]Paired[blank_end]
A developer wants to know if the houses in two different neighborhoods have the same mean price. He selects 10 houses from each neighborhood at random and tests the null hypothesis that the means are equal. [blank_start]Independent[blank_end]
A manager wants to know if the mean productivity of two workers is the same. For a random sample of 30 hours in the past month, she compares the number of items produced by each worker during the same hour. [blank_start]Paired[blank_end]
Answer
-
Independent
-
Paired
-
Independent
-
Paired
-
Independent
-
Paired
Question 16
Question
A developer is recording information about houses in two different neighborhoods, including the year in which they were built. She takes a random sample of 30 houses from Neighborhood 1 and a random sample of 35 houses from Neighborhood 2, resulting in the following summary statistics:
x¯1=57.2; s1=9.51
x¯2=47.6; s2=6.15
Use this information to calculate the lower bound of the 90% (un-pooled) confidence interval for the true difference (neighborhood 1 - neighborhood 2) in average age for houses in these neighborhoods. Use technology (such as an online t-distribution calculator) to find the appropriate value of the multipler.
Round your answer to 3 decimal places.
Answer: [blank_start]6.222[blank_end]
Answer
-
6.222
Question 17
Question
What assumptions are required for the independent-samples confidence interval to be valid?
Answer
-
The samples must be matched pairs.
-
The samples must be random.
-
The populations must be normally distributed.
-
The population of differences must be normally distributed.
-
The samples must be independent.
Question 18
Question
Lower income individuals who live in rural areas often have very long commutes to their jobs. As the price of fuel continues to increase these individuals may be at a substantial economic disadvantage. A researcher is comparing subjects in two rural areas of the Midwest. In the first area (Area 1) many of the workers commute to relatively new jobs in the shipping and transportation industry. In the other area (Area 2) the workers commute to manufacturing jobs in large towns that surround the area. The researcher took random samples from both areas and asked the workers about their commuting distances. The resulting values are given below. We would like to conduct a test of hypothesis about to see if there is a significant difference between the commute distances. Calculate the appropriate test statistic for this case (Take your difference so that your answer is positive).
Round your answer to 2 decimal places.
Area Mean St. Dev Sample size(n)
1 78.7 20.7 100
2 53.7 11.1 150
Answer: [blank_start]11.06[blank_end]
Answer
-
11.06
Question 19
Question
Do males and females consume different amounts of sweetened soft drinks? A study compared male and female students in the 4th grade. The study recorded the daily intake (in fluid ounces) of sodas, fruit drinks and other sweetened drinks of 20 males and 20 females. The resulting summary statistics are given below.
Gender n mean St. dev
male 20 18.3 11.3
female 20 15.4 10.3
We would like to perform a test of hypothesis based on the pooled variance. Calculate the pooled VARIANCE in this situation.
Round your answer to 2 decimal places.
Answer: [blank_start]116.89[blank_end]
Answer
-
116.89
Question 20
Question
A study is conducted to see how effective aspirin is in reducing temperature in children. A sample of 6 children suffering from influenza had their temperatures taken immediately before and 1 hour after administration of aspirin. The results are given below. We would like to conduct a paired differences t-test for this situation. The data follow.
Patient Temperature Before Temperature After Difference
1 10.7 98.4 2.3
2 102.7 101.6 2.1
3 101.7 99.9 1.8
4 102.7 100.6 2.1
5 101.7 99.9 1.8
6 100.7 99.7 3.0
Mean 101.9 99.7 2.2
Std. Dev. 1.2 1.4 0.4
Calculate the appropriate test statistic of a matched pairs t-test for this data to see if taking aspirin will reduce a child's fever.
Round your answer to 2 decimal places.
Answer: [blank_start]-13.47[blank_end]
Answer
-
-13.47
Question 21
Question
A study is conducted to see how effective aspirin is in reducing temperature in children. A sample of 6 children suffering from influenza had their temperatures taken immediately before and 1 hour after administration of aspirin. The results are given below. We would like to conduct a paired differences t-test for this situation. The data follow.
Patient Temperature Before Temperature After Difference
1 10.7 98.4 2.3
2 102.7 101.6 2.1
3 101.7 99.9 1.8
4 102.7 100.6 2.1
5 101.7 99.9 1.8
6 100.7 99.7 3.0
Mean 101.9 99.7 2.2
Std. Dev. 1.2 1.4 0.4
Which null distribution should be used to find the appropriate p-value for this test?
Answer
-
a. t-distribution with df=10
-
b. t-distribution with df=5
-
c. t-distribution with df=6
-
d. Standard normal distribution
Question 22
Question
At a large university it is known that 40% of the students live on campus. The director of student life is going to take a random sample of 200 students. What is the probability that more than half of the sampled students live on campus?
Give your answer to 3 decimal places.
Answer: [blank_start]0.002[blank_end]
Answer
-
0.002
Question 23
Question
A sample of 900 college freshmen were randomly selected for a national survey. Among the survey participants, 372 students were pursuing liberal arts degrees. The sample proportion is 0.413.
What is the margin of error for a 98% confidence interval for this sample? [blank_start]0.038[blank_end]
What is the lower endpoint for the 98% confidence interval? [blank_start]0.375[blank_end]
Answer
-
0.038
-
0.375
Question 24
Question
A fair six-sided die is defined as a die that will have each of the 6 faces of the die comp up one-sixth of the time in the long run. A loaded six-sided die is defined as a die that has one face of the die that comes up more often than one-sixth of the time in the long run.
An avid Yahtzee player wants to know whether or not his lucky die is loaded so that 6's appear more often than any other number. He throws his lucky die 85 times and noted that he rolled a 6 on 15 of those rolls. What are the hypothesis and conclusion for this experiment?
Answer
-
H0: p = 0
-
H0: p = 1/6
-
H0: p = 6
-
HA: p > 0
-
HA: p > 1/6
-
There is evidence that the die is loaded since the p-value is less than .05.
-
There is evidence that the die is loaded since the p-value is greater than .05.
-
There is evidence that the die is fair since the p-value is less than .05.
-
There is evidence that the die is fair since the p-value is greater than .05.
Question 25
Question
In a large study, a random sample of 595 pet owners and a random sample of 1939 people who do not own a pet was selected. Of the pet owners, 53.3% were married. Of the non-pet owners, 57.7% were married. Use this information to calculate the 90% confidence interval for the difference in the true proportions of pet owners who are married and the proportion of non-pet owners who are married. (Note: calculate the differences as non-pet owners minus pet owners.) Which of the following are true statements?
Answer
-
The 90% confidence interval is (-0.016, 0.104).
-
The 90% confidence interval is (-0.001, 0.090).
-
The 90% confidence interval is (0.006, 0.083).
-
We are 90% confident that the true difference in proportions is in the interval we calculated.
-
We believe that 90% of future samples pet owners and non-pet owners will have a difference in proportions that is in the interval we calculated.
Question 26
Question
A 2011 Sleep in America Poll surveyed a random sample of U.S. residents about their sleeping habits. Of the 469 individuals ages 30-45 years old (Gen-X), 50% reported using the Internet in the hour before trying to fall asleep at least a few nights a week. In contrast, 70% of the 293 individuals aged 19-29 ("Gen-Y") reported Internet use before sleep. Calculate the test statistic that would be used to test the hypothesis that those in Gen-X are less likely to use the Internet before sleep than those in Gen-Y. (Calculate the differences as Gen-X minus Gen-Y).
Report your answer to 2 decimal places.
Answer: [blank_start]-5.66[blank_end]
Answer
-
-5.66
Question 27
Question
A 2011 Sleep in America Poll surveyed a random sample of U.S. residents about their sleeping habits. Of the 469 individuals ages 30-45 years old (Gen-X), 50% reported using the Internet in the hour before trying to fall asleep at least a few nights a week. In contrast, 70% of the 293 individuals aged 19-29 ("Gen-Y") reported Internet use before sleep.
What would be the appropriate p-value for testing the hypothesis that those in Gen-X are less likely to use the Internet before sleep than those in Gen-Y (again with the differences calculated as Gen-X minus Gen-Y).
Answer
-
The p-value would represent probability of getting a test statistic less than or equal to the one we calculated, assuming there is no difference in the proportions for those in Gen-Y and Gen-X who use the Internet before sleep.
-
The p-value would represent probability of getting a test statistic greater than or equal to the one we calculated, assuming there is no difference in the proportions for those in Gen-Y and Gen-X who use the Internet before sleep.
-
The p-value would represent probability of getting a test statistic more extreme than the one we calculated, assuming there is no difference in the proportions for those in Gen-Y and Gen-X who use the Internet before sleep.
Question 28
Question
For each of the following situations, select the type of test that should be used.
A researcher wants to find out whether education level (some high school, high school graduate, college graduate, or advanced degree) is related to the type of transaction most likely to be conducted using the internet (shopping, banking, travel reservations, or auctions).
[blank_start]Chi-Square test of Independence[blank_end]
A car manufacturer wants to see if the quality of a car is affected by what day it was built. It will examine warranty claims to determine if defects are equally distributed across the days of the work week.
[blank_start]Chi-square test of goodness of fit[blank_end]
The academic research office at a large community college wants to see whether the distribution of courses chosen (Humanities, Social Science, or Science) is different for its residential and nonresidential students.
[blank_start]Chi-square test of homogeneity[blank_end]
Answer
-
Chi-Square test of Independence
-
Chi-Square test of goodness of fit
-
Chi-Square test of homogeneity
-
Chi-Square test of independence
-
Chi-square test of goodness of fit
-
Chi-Square test of homogeneity
-
Chi-Square test of independence
-
Chi-Square test of goodness of fit
-
Chi-square test of homogeneity
Question 29
Question
The number of defective items produced in a week by each of 5 different production lines (called A, B, C, D, and E) is as follows:
A B C D E Total
15 27 31 19 11 103
This data will be used to test if the lines are of equal quality.
If the production lines are of equal quality, how many defective items would we expect to be produced by line C?
Round your answer to one decimal place.
Answer: [blank_start]20.6[blank_end]
Answer
-
20.6
Question 30
Question
The number of defective items produced in a week by each of 5 different production lines (called A, B, C, D, and E) is as follows:
A B C D E Total
15 27 31 19 11 103
This data will be used to test if the lines are of equal quality.
What is the value of the Chi-square statistic for this test?
Round your answer to 3 decimal places.
Answer: [blank_start]13.359[blank_end]
Answer
-
13.359
Question 31
Question
The number of defective items produced in a week by each of 5 different production lines (called A, B, C, D, and E) is as follows:
A B C D E Total
15 27 31 19 11 103
This data will be used to test if the lines are of equal quality.
The p-value for this test is 0.0096. What are the appropriate decision and conclusion at the 1% significance level?
Answer
-
We cannot reject the null hypothesis.
-
We reject the null hypothesis.
-
There is not enough evidence to say that the production lines are not of equal quality.
-
There is evidence that the production lines are not of equal quality.
Question 32
Question
A simple linear regression analysis was performed about the relationship between the weight (in lbs) of a car and the number of miles per gallon (mpg) of gas it gets on the highway. The following equation for the regression line is:
Highway MPG = 51.601 - 0.00733 Weight
If your car weighs 3620 lbs, what is its predicted highway mpg?
Give your answer to 2 decimal places.
Answer: [blank_start]25.07[blank_end]
Answer
-
25.07
Question 33
Question
A simple linear regression analysis was performed about the relationship between the weight (in lbs) of a car and the number of miles per gallon (mpg) of gas it gets on the highway. The following equation for the regression line is:
Highway MPG = 51.601 - 0.00733 Weight
Tori's car weighs 3495 lbs and it gets 23 mpg on the highway. What is the residual value for Tori's car?
Give your answer to 3 decimal places.
Answer: [blank_start]-2.983[blank_end]
Answer
-
-2.983
Question 34
Question
Which of the following numbers represents the correlation for the above scatter plot?
Answer
-
-0.92
-
0.62
-
0.98
-
+0.03
-
-0.65
-
-0.04
Question 35
Question
Which of the following numbers represents the correlation for the above scatter plot?
Answer
-
-0.99
-
0.24
-
-0.12
-
-0.67
-
0.76
-
0.45
Question 36
Question
The coefficient of determination, r2, for the above scatter plot is 0.787. What is the correlation coefficient, r?
Give your answer to 3 decimal places.
Answer: [blank_start]-0.887[blank_end]
Answer
-
-0.887
Question 37
Question
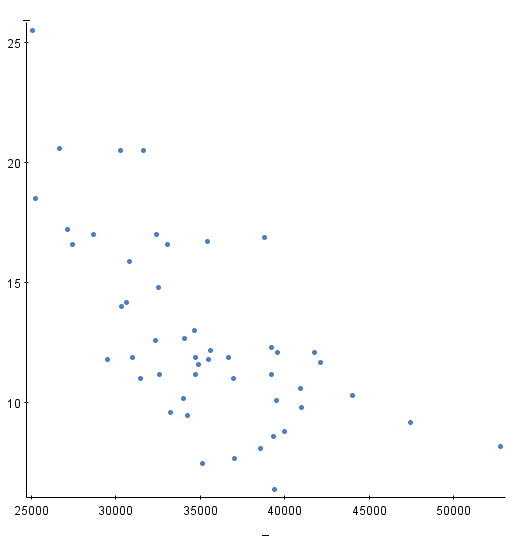
Below is a scatter plot of data comparing the percentage of a state's population enrolled in college versus the number of crimes per 100,000 people. An officer at the Bureau of Justice Statistics wanted to determine the amount of crimes that should be expected if only 20% of a state's population was college educated. Is it appropriate to predict the crime for a state with 20% having a college
education?
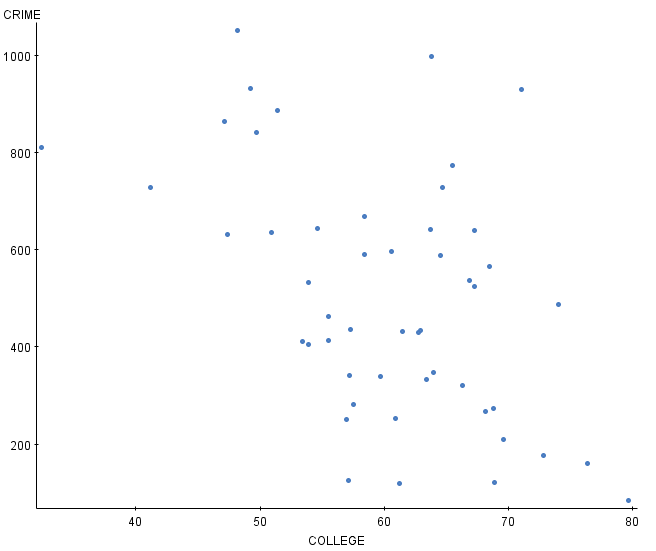
Answer
-
Yes, because the slope of the regression line will be negative.
-
Yes, because the y-intercept of the regression line will be positive.
-
No, because we would be trying to find a value outside of our data range.
-
No, because the data is not at all linear.
-
Yes, as long as we can find the regression line.
Question 38
Question
A researcher interested in the habits of smokers collected data on the number of cigarettes smoked in one month and the number of time they visited church that month. The correlation for these two variables ended up being -0.74. If a smoker who had never been to church started attending church regularly what should we expect to happen?
Answer
-
The smoker will not attend church for very long.
-
We can not conclude anything about the future habits of the smoker.
-
The smoker will smoke less cigarettes.
-
The smoker will smoke more cigarettes.
Question 39
Question
A researcher was conducting a study of homes in a large midwestern city based on a random sample of 125 homes. Two variables she collected information on were the size of the home (in square feet) and the year in which the home was built. She hypothesizes that there will be a positive relationship between the age of the home and its size (meaning that newer homes tend to be larger than older homes). The parameter estimates table from a regression of size on year is show below. What is the p-value we would use to test the researcher's hypothesis?
Parameter Estimates:
Parameter DF Parameter Estimate Standard Error t Value Pr>|t|
Intercept 1 -24243.02 8273.345 -2.9302561 0.0042
Year 1 13.144587 4.186961 3.1394098 0.0022
Answer
-
0.0011
-
0.0022
-
0.9989
-
0.0042
Question 40
Question
The researcher also recorded the price (in dollars) for the sample of 125 homes. Partial output for a regression of price on size is given below. The researcher also calculated that the average price of the homes in this sample was $300,586, the average size of a home was 1937 square feet, and that Sxx = 36,726,258.
Calculate the margin of error for a 95% confidence interval for the slope of the regression line.
Round your answer to 3 decimal places.
Answer: [blank_start]15.802[blank_end]
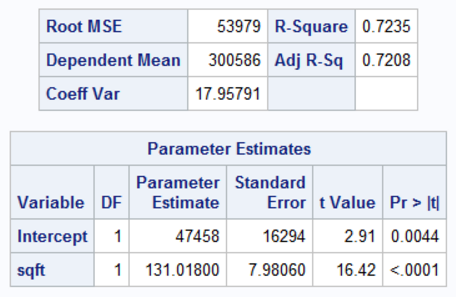
Answer
-
15.802
Question 41
Question
The researcher also recorded the price (in dollars) for the sample of 125 homes. Partial output for a regression of price on size is given below. The researcher also calculated that the average price of the homes in this sample was $300,586, the average size of a home was 1937 square feet, and that Sxx = 36,726,258.
What is the predicted price for a home that is 2500 square feet in size? Report your answer to the nearest dollar (do not include any symbols, such as a dollar sign or comma, in your answer).
Answer: [blank_start]375003[blank_end]
Answer
-
375003
Question 42
Question
The researcher also recorded the price (in dollars) for the sample of 125 homes. Partial output for a regression of price on size is given below. The researcher also calculated that the average price of the homes in this sample was $300,586, the average size of a home was 1937 square feet, and that Sxx = 36,726,258.
Calculate the margin of error for a 95% confidence interval for the average price of homes that are 2500 square feet large. Round your answer to the nearest dollar (do not include any symbols, such as a dollar sign or comma, in your answer).
Answer: [blank_start]13783[blank_end]
Answer
-
13783
Question 43
Question
The researcher also recorded the price (in dollars) for the sample of 125 homes. Partial output for a regression of price on size is given below. The researcher also calculated that the average price of the homes in this sample was $300,586, the average size of a home was 1937 square feet, and that Sxx = 36,726,258.
Calculate the margin of error for a 95% prediction interval for an individual home that is 2500 square feet large. Round your answer to the nearest dollar (do not include any symbols, such as a dollar sign or comma, in your answer).
Answer: [blank_start]107763[blank_end]
Answer
-
107763
Want to create your own Quizzes for free with GoConqr? Learn more.