
Quiz
Chapter 4
Create a free account to finish this quiz
Save your progress and see your final score.
Already have an account? Sign in
Questions in this quiz (20)
1Which of the following sets of scores has the greatest variability?
- A2, 3, 7, 12
- B13, 15, 16, 17
- C24, 25, 26, 27
- D42, 44, 45, 46
2 What is the range for the following set of scores? 3, 7, 9, 10, 12
- A3 points
- B4 or 5 points
- C9 or 10 points
- D12 points
3How many scores in the distribution are used to compute the range?
- AOnly 1
- B2
- C50%
- DAll or the scores
4Standard deviation is probably the most commonly used value to describe and measure variability. Which of the following accurately describes the concept of standard deviation?
- AThe average distance between one score and another.
- BThe average distance between a score and the mean.
- CThe total distance from the smallest score to the largest score.
- DOne half of the total distance from the smallest score to the largest score.
5What is the variance for the following set of scores? 2, 2, 2, 2, 2
- A0
- B2
- C4
- D5
6Which of the following values is the most reasonable estimate of the standard deviation for the set of scores in the following distribution? (It may help to imagine or sketch a histogram of the distribution.)
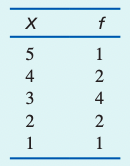
- A0
- B1
- C3
- D5
7What is the value of SS, the sum of the squared deviations, for the following population of N 5 4 scores?
Scores: 1, 4, 6, 1- A0
- B18
- C54
- D144
8Each of the following is the sum of the scores for a population of N 5 4 scores. For which population would the definitional formula be a better choice than the computational formula for calculating SS.
- AEX = 9
- BEX = 12
- CEX = 15
- DEX = 19
9What is the standard deviation for the following population of scores?
Scores: 1, 3, 7, 4, 5- A20
- B5
- C4
- D2
10If sample variance is computed by dividing by n, instead of n 2 1, how will the obtained values be related to the corresponding population variance.
- AThey will consistently underestimate the population variance.
- BThey will consistently overestimate the population variance.
- CThe average value will be exactly equal to the population variance.
- DThe average value will be close to, but not exactly equal to, but not equal to, the population variance.
11What is the value of SS, the sum of the squared deviations, for the following sample? Scores: 1, 4, 0, 1
- A36
- B18
- C9
- D3
12 What is the variance for the following sample of n 5 4 scores?
Scores; 2, 5, 1, 2- A34/3 = 11.33
- B9/4 = 2.25
- C9/3 = 3
- D√3 = 173
13What is meant by a biased statistic.
- AThe average value for the statistic overestimates the corresponding population parameter.
- BThe average value for the statistic underestimates the corresponding population parameter.
- CThe average value for the statistic either overestimates or underestimates the corresponding population parameter.
- DThe average value for the statistic is exactly equal to the corresponding population parameter.
14A researcher selects all the possible samples with n 5 3 scores from a population and computes the sample variance, dividing by n – 1, for each sample. If the population variance is s2 5 6, then what is the average value for all of the sample variances?
- A6
- BGreater than 6
- CLess than 6
- DImpossible to determine
15Which of the following is an example of an unbiased statistic.
- AThe sample mean.
- BThe sample variance (dividing by n - 1).
- CBoth the sample mean and the sample variance (dividing by n - 1).
- DNeither the sample mean nor the sample variance (dividing by n - 1).
16How is the standard deviation represented in a frequency distribution graph?
- ABy a vertical line located at a distance of one standard deviation above the mean.
- BBy two vertical lines located one standard deviation above the mean and one standard deviation below the mean.
- CBy a horizontal line or arrow extending from a location one standard deviation above the mean to a location one standard deviation below the mean.
- DBy a horizontal line or arrow extending from the mean for a distance equal to one standard deviation.
17A population has a mean of m 5 35 and a standard deviation of s 5 5. After 3 points
are added to every score in the population, what are the new values for the mean and
standard deviation?- Aµ = 35 and O = 5
- Bµ = 35 and O = 8
- Cµ = 38 and O = 5
- Dµ = 3 and O = 8
18What symbols are used for the mean and standard deviation for a sample in a research report?
- AThe mean is identified by the letter M and the standard deviation is represented
by a lowercase s. - BThe mean is identified by the letter M and the standard deviation is represented
by SD. - CThe mean is identified by a lowercase letter m and the standard deviation is
represented by a lowercase s. - DThe mean is identified by a lowercase letter m and the standard deviation is
represented by SD.
- AThe mean is identified by the letter M and the standard deviation is represented
19Under what circumstances would a score that is above the mean by 5 points appear to be very close to the mean?
- AWhen the mean is much greater than 5
- BWhen the mean is much less than 5
- CWhen the standard deviation is much greater than 5
- DWhen the standard deviation is much less than 5
20For which of the following pairs of distributions would the mean difference be easiest to see?
- AM = 45 with s = 5 compared to M = 50 with s = 5.
- BM = 45 with s = 5 compared to M = 55 with s = 5.
- CM = 45 with s = 10 compared to M = 50 with s = 10.
- DM = 45 with s = 10 compared to M = 55 with s = 10.
Information
- Description
- Year 1 Statistics I Quiz on Chapter 4, created by Eloise Brisson on 22/08/2022.
- Author
- Eloise Brisson
- Language
- English
- Views
- 0
- Tags
- Rating
- No ratings yet Rate this quiz