
exam 1
Slides in this set (23)
-
- Simply, put an educated guess about a relationship
- Should be based on theory
- Includes independent and dependant variables
- Directionality
-
- Discrete Variable
- Variables with a fixed number of values
- Continuous Variable
- Variables with an infinite range of values
- Independent Variable
- Variable that influences an outcome
- Dependant Variable
- Variable that is influenced by an independent variable
-
- Nominal
- Ordinal
- Interval
- Ratio
-
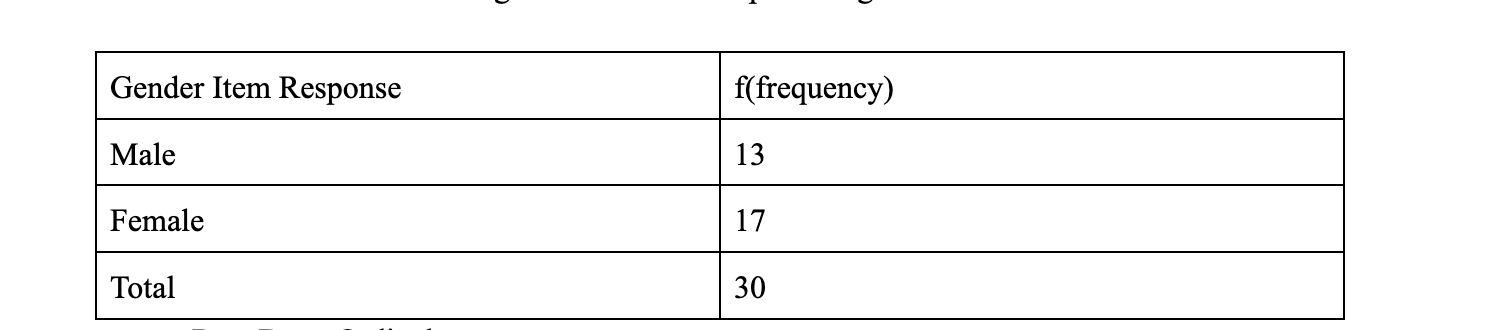
- Caption: What's your gender?
- Uses numbers to represent names
- Numbers are not representative of value
- Exhaustive and mutually exclusive
-
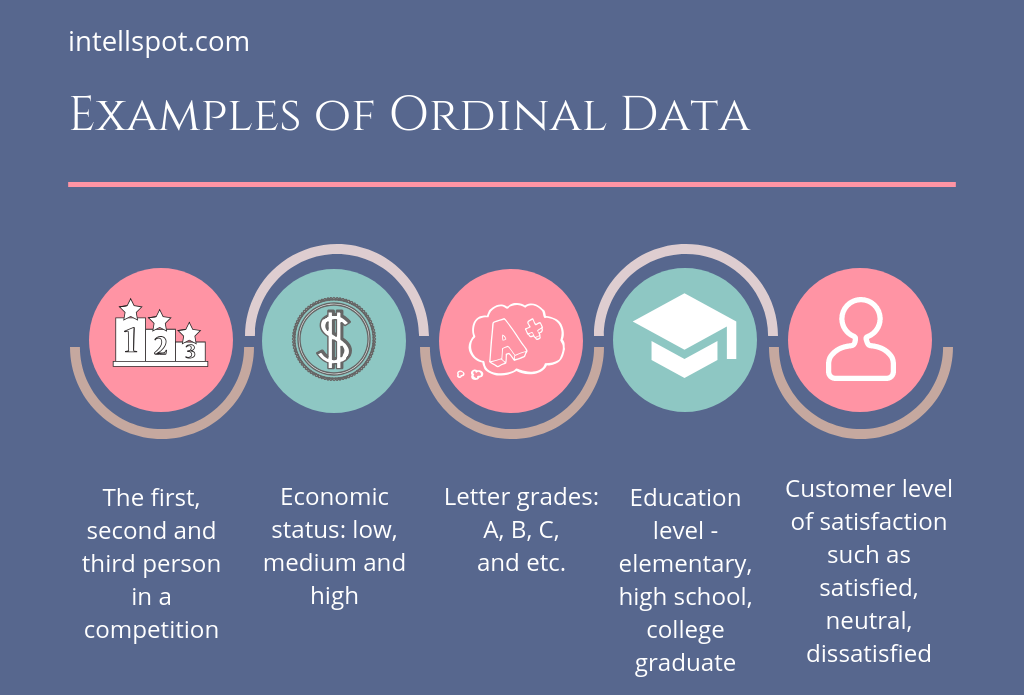
- Uses numbers to convey rank
- Most common level of measurement
-
- Ratio data has an absolute zero point
- Ratio examples: age, net worth
- Distance (interval) between numbers is meaningful and consistent
- Interval examples: temperature, IQ
-
- Two groups to be studied: control and experimental
- Experimental group receives independent variable
- No control group - comparison group
-
Experiment vs Quasi-Experiment example
- In a study of prison safety, researchers want to know if providing mandatory inmate counseling will reduce inmate violence
- Experiment - 100 inmates are randomly selected to participate, 50 are randomly assigned to receive counseling (experimental), 50 do (not control)
- Quasi-experiment - 50 inmates sign up to receive mandatory counseling (experimental), and 50 similar inmates do not (comparison)
-
Descriptive Stats Inferential Stats
- Summarize raw data
- Describe how people responded
- Represent building blocks for subsequent analyses
- Test hypotheses
- Compare variables
- Determine cause and effect
- Aid decision making
-
- Proportion = frequency/total number or p = f/n
- Percentage = (100) frequency/total number or % = (100) f/n
-
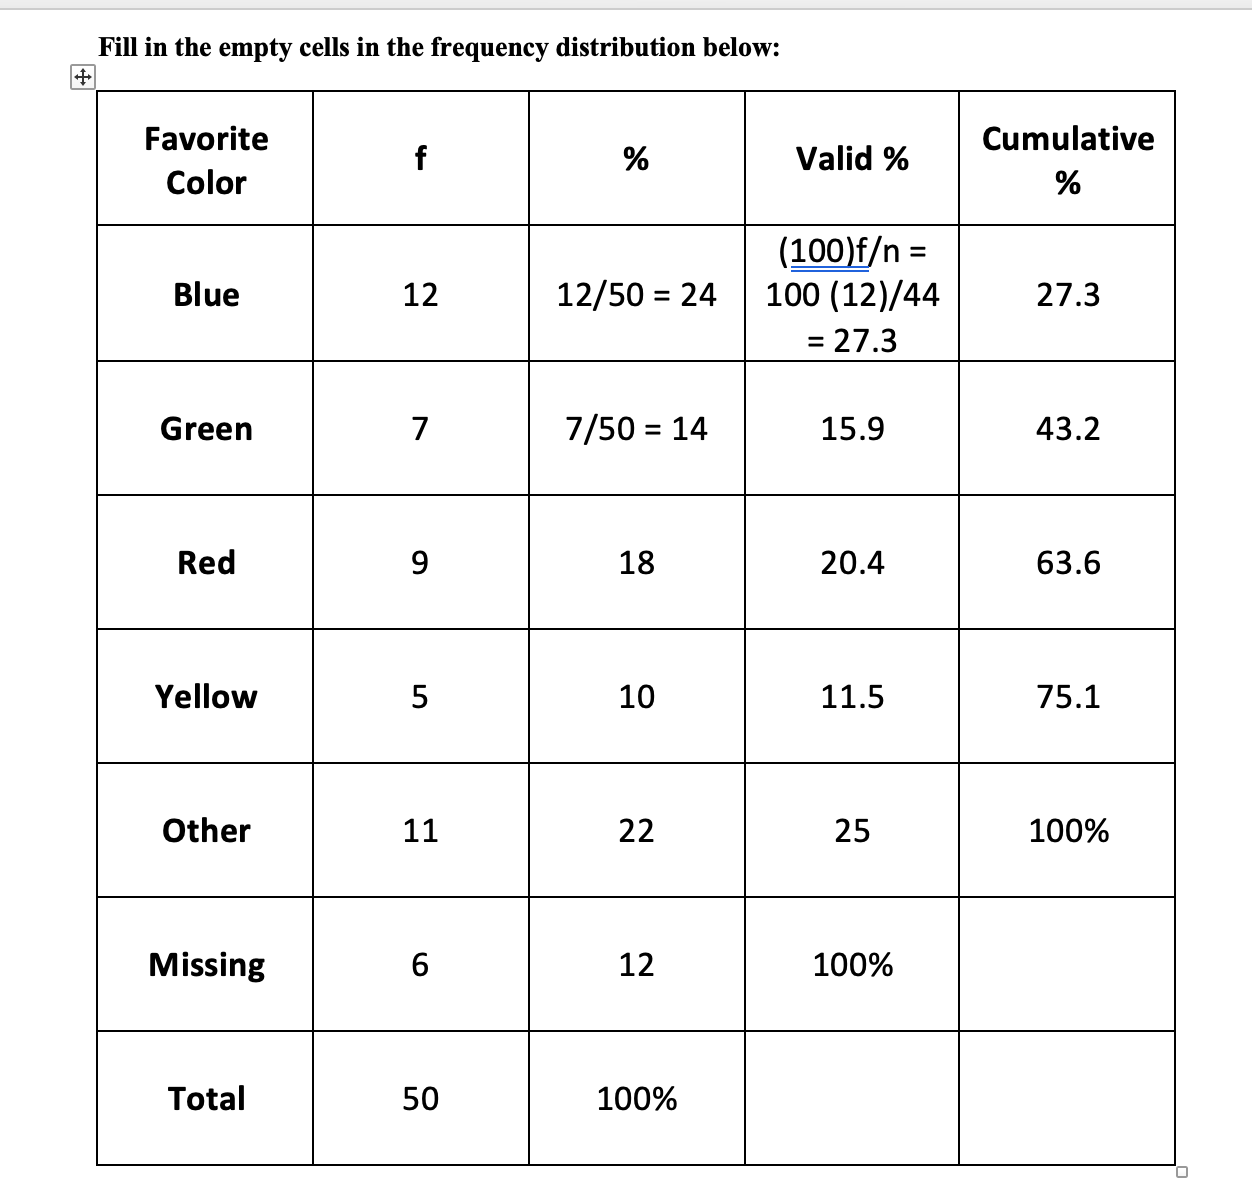
- Valid percentage uses valid N as the denominator
- (N) total number minus (M) missing observations
- Valid % = (100) frequency/total number - missing number
- Caption: what's your fav color freq chart ex
-
- Good for nominal and ordinal data
- Quickly determine 100% is shown
- Intuitively display
- Easy to interpret
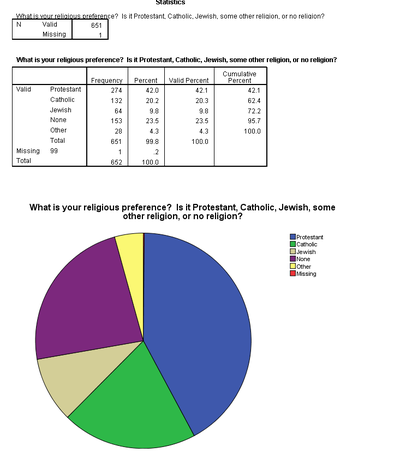
- Caption: pie chart in spss
-
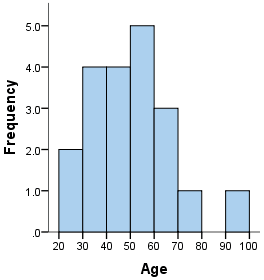
- Ordinal and interval data
- Extension of the bar chart
- non-cumulative/cumulative
-
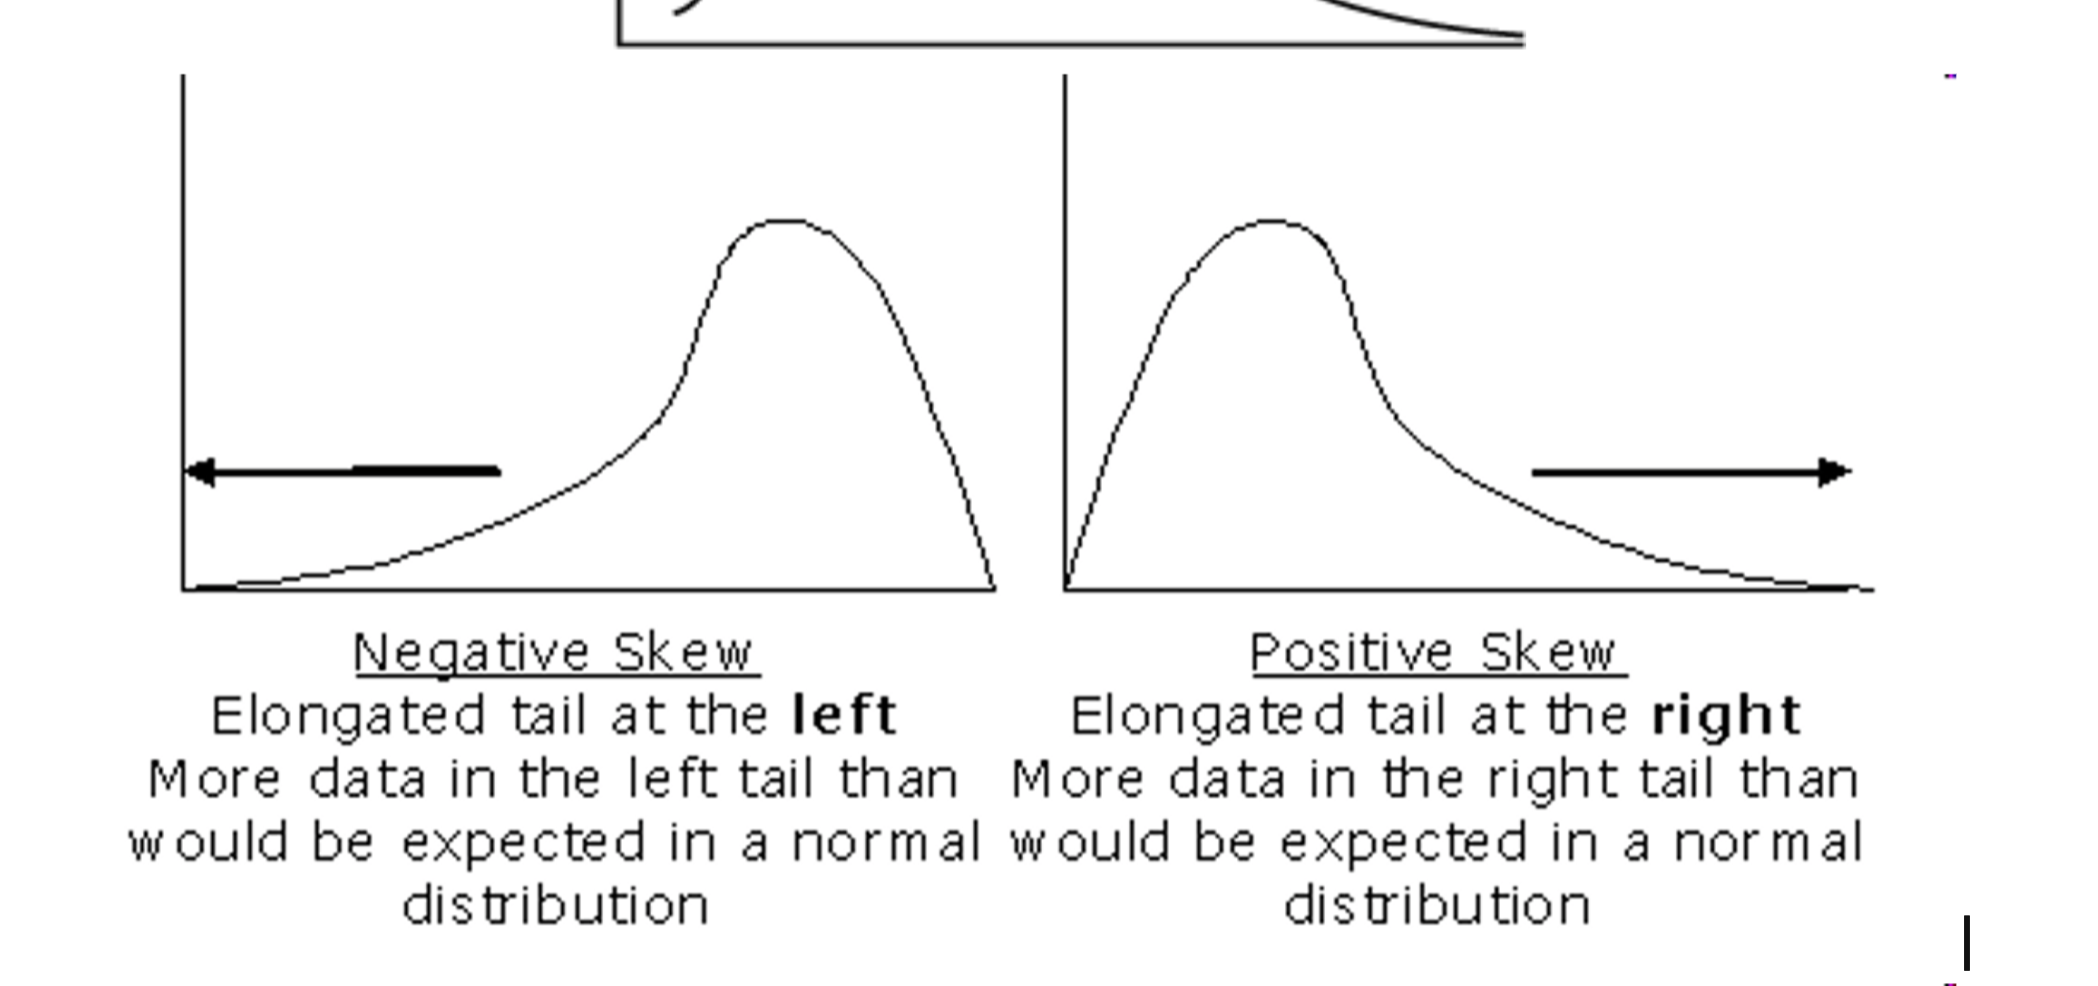
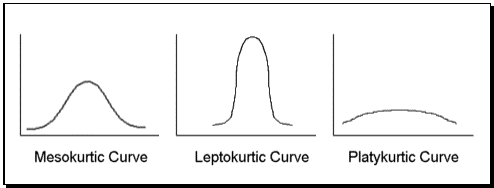
- Symmetry
-
-
- Skewness differentiates extreme values in one versus the other tail, kurtosis measures extreme values in either tail.
-
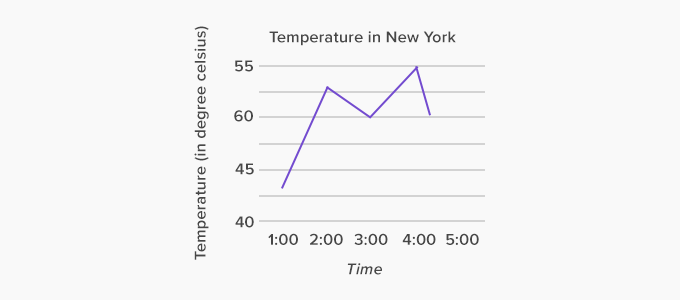
- X-axis usually depicts time
- Single or multiple variables
- Comparison of variables
-
- The most frequent value in a distribution
- unimodal/bimodal
- If there is one highest value, the distribution is unimodal; if two, the distribution is bimodal
-
- The median is the score that divides the frequency distribution in half.
-
- Most common measure of central tendency
- Ordinal and interval
- Used in most other statistical procedures
- *Add up all the scores and divide by the number of scores*
-
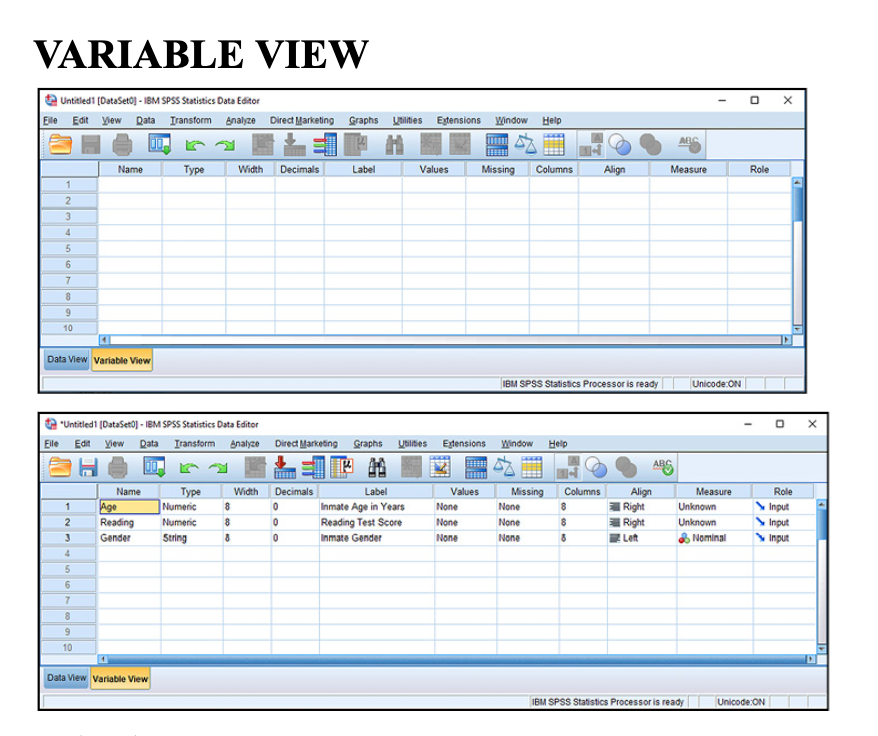
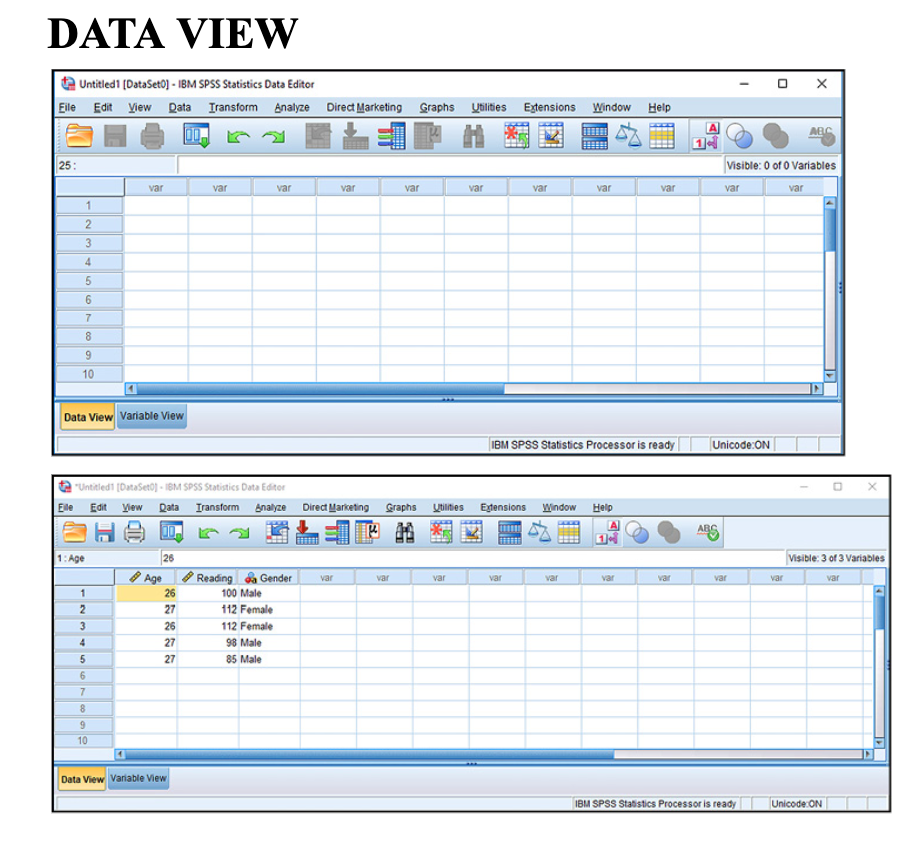
Data vs. Variable View in SPSS
- Both windows in the Data Editor display aspects of the contents of a data file.
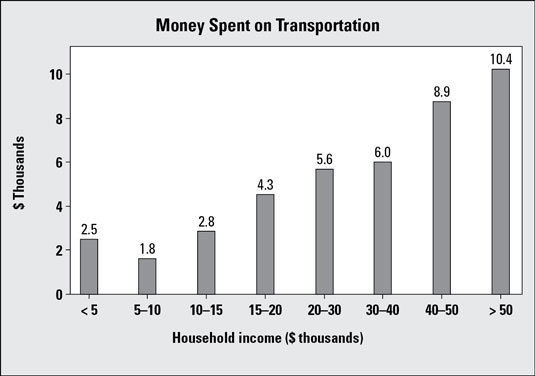
- In Data View, the rows represent cases (e.g., the scores for each participant in a research study) and the columns represent variables (i.e., the things we want to measure)
- In Variable View, the rows represent variables and the columns represent the attributes of each variable.
- Data View contains the data that will be analyzed and Variable View contains information about the variables themselves.
-
Variable View vs. Data View in SPSS
Information
- Description
- Mathematics Slide Set on exam 1, created by Anna Andersen on 05/10/2021.
- Created by
- Anna Andersen
- Views
- 8
- Rating