
Mindmap
Null hypoth, chi-squares, p-values, CI
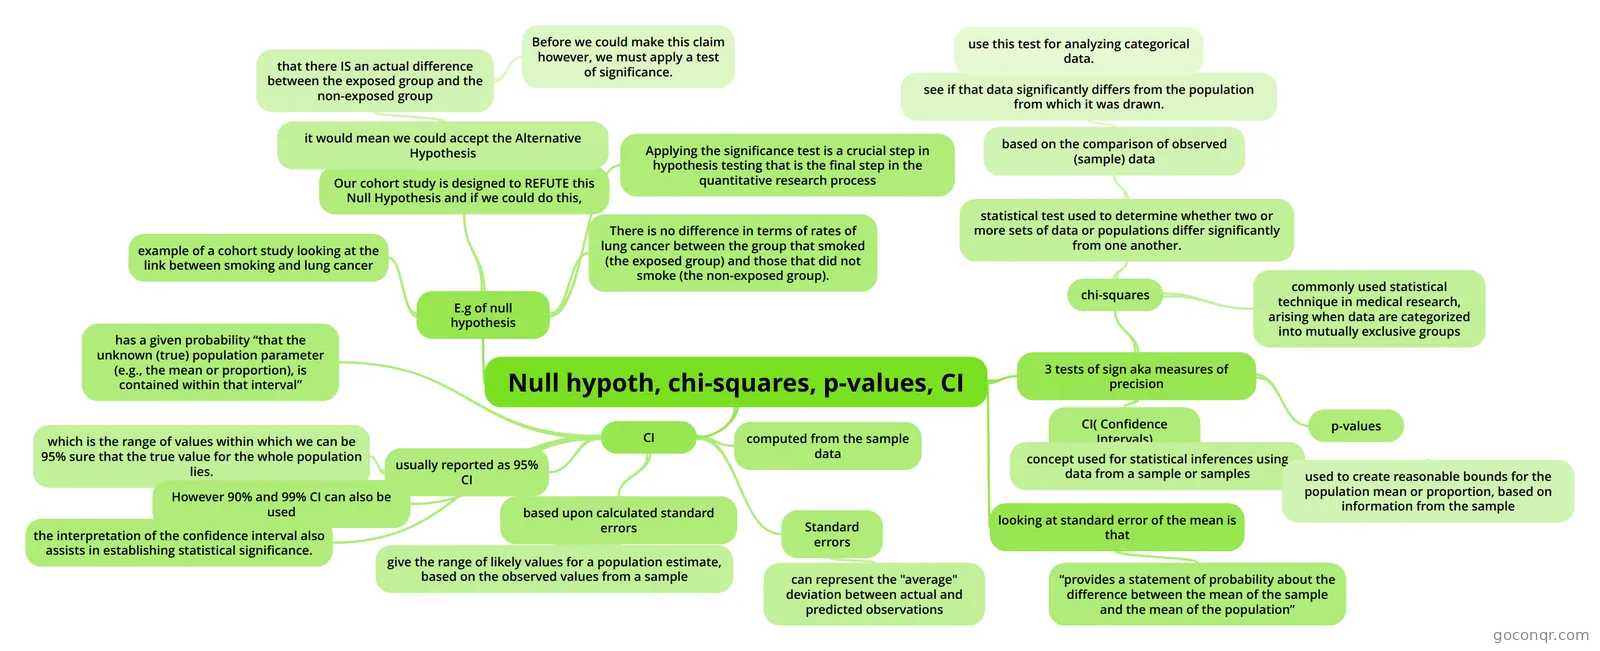
Mind map: null hypothesis, chi-squares, p-values and confidence intervals
Inhalt der Mindmap
Null hypoth, chi-squares, p-values, CI
E.g of null hypothesis
- example of a cohort study looking at the link between smoking and lung cancer
- There is no difference in terms of rates of lung cancer between the group that smoked (the exposed group) and those that did not smoke (the non-exposed group).
- Our cohort study is designed to REFUTE this Null Hypothesis and if we could do this,
- it would mean we could accept the Alternative Hypothesis
- that there IS an actual difference between the exposed group and the non-exposed group
- Before we could make this claim however, we must apply a test of significance.
- that there IS an actual difference between the exposed group and the non-exposed group
- it would mean we could accept the Alternative Hypothesis
- Applying the significance test is a crucial step in hypothesis testing that is the final step in the quantitative research process
3 tests of sign aka measures of precision
- chi-squares
- statistical test used to determine whether two or more sets of data or populations differ significantly from one another.
- based on the comparison of observed (sample) data
- see if that data significantly differs from the population from which it was drawn.
- use this test for analyzing categorical data.
- see if that data significantly differs from the population from which it was drawn.
- based on the comparison of observed (sample) data
- commonly used statistical technique in medical research, arising when data are categorized into mutually exclusive groups
- statistical test used to determine whether two or more sets of data or populations differ significantly from one another.
- p-values
- CI( Confidence Intervals)
- concept used for statistical inferences using data from a sample or samples
- used to create reasonable bounds for the population mean or proportion, based on information from the sample
- concept used for statistical inferences using data from a sample or samples
- chi-squares
CI
- computed from the sample data
- has a given probability “that the unknown (true) population parameter (e.g., the mean or proportion), is contained within that interval”
- usually reported as 95% CI
- which is the range of values within which we can be 95% sure that the true value for the whole population lies.
- However 90% and 99% CI can also be used
- the interpretation of the confidence interval also assists in establishing statistical significance.
- based upon calculated standard errors
- give the range of likely values for a population estimate, based on the observed values from a sample
- Standard errors
- can represent the "average" deviation between actual and predicted observations
looking at standard error of the mean is that
- “provides a statement of probability about the difference between the mean of the sample and the mean of the population”
Informationen
- Beschreibung
- HBS108 (Topic 8.4 Statistical inference and hypothesis testing: Conf) Mindmap am Null hypoth, chi-squares, p-values, CI, erstellt von shirley.ha am 15/09/2013.
- Erstellt von
- shirley.ha
- Aufrufe
- 132
- Tags
- Bewertung